Cell Detection Parameters#
It would be very convenient to be able to say “increase parameter p to detect more cells”.
The suite2p documentation only make that declaration for threshold_scaling,
stating that decreasing this parameter will yield more cells.
However, we have found this not always to be the case.
Example Dataset
Example dataset collected by Will Snyder with Dr. Charles Gilbert @ Rockefeller University.
Field |
Value |
|---|---|
Date |
2025-03-06 |
Virus |
jGCaMP8s |
Framerate |
17 Hz |
FOV (Per ROI) |
448 µm × 896 µm |
Resolution |
2 µm × 2 µm × 16 µm |
Num-Planes |
14 |
Duration |
~ 2 min |
Parameters#
The parameters covered here are only some of the more influential parameters.
threshold_scaling: This is a scale factor which determines how bright a signal needs to be to seed an ROI.sparse_mode: Speeds up ROI detection by iteratively seeding and growing regions distinct regions on a binned movie, helpful for separating dendritic segmentation (set to False) and somatic segmentation (set to True).anatomical_only: Enables anatomical segmentation using Cellpose, bypassing Suite2p’s functional ROI detection. The value determines which image is used:Value
Image Used
Description
1max_proj / mean_imgRatio of the max projection to the mean image; highlights active areas relative to baseline.
2mean_imgThe average image over all frames; provides baseline structural contrast.
3meanImgEAn enhanced version of the mean image using Suite2p’s sharpening/filtering; highlights edges and features.
0or FalseDisabled
Anatomical detection is off; functional detection (correlation-based) is used instead.
diameter: Approximate diameter of ROIs, in pixels. Used to set the scale for filters and Cellpose segmentation.flow_threshold: Minimum Cellpose flow error to consider a region valid. Lower values include more ROIs.cellprob_threshold: Probability threshold from Cellpose’s output to determine whether a pixel belongs to a cell. More negative values include more pixels.spatial_hp_cp: Amount of high-pass filtering applied to the image before Cellpose segmentation. A float between0and1.tau: Fluorescence decay time constant (in seconds). Used to determine binning length for the movie and influences temporal filtering and deconvolution.max_overlap: Maximum allowed spatial overlap (0–1) between ROIs. 0 will delete every ROI, 1 will keep all ROI’s.
Defaults#
To see the effect of each parameter on segmentation results, its helpful to start with the default parameters as a baseline.
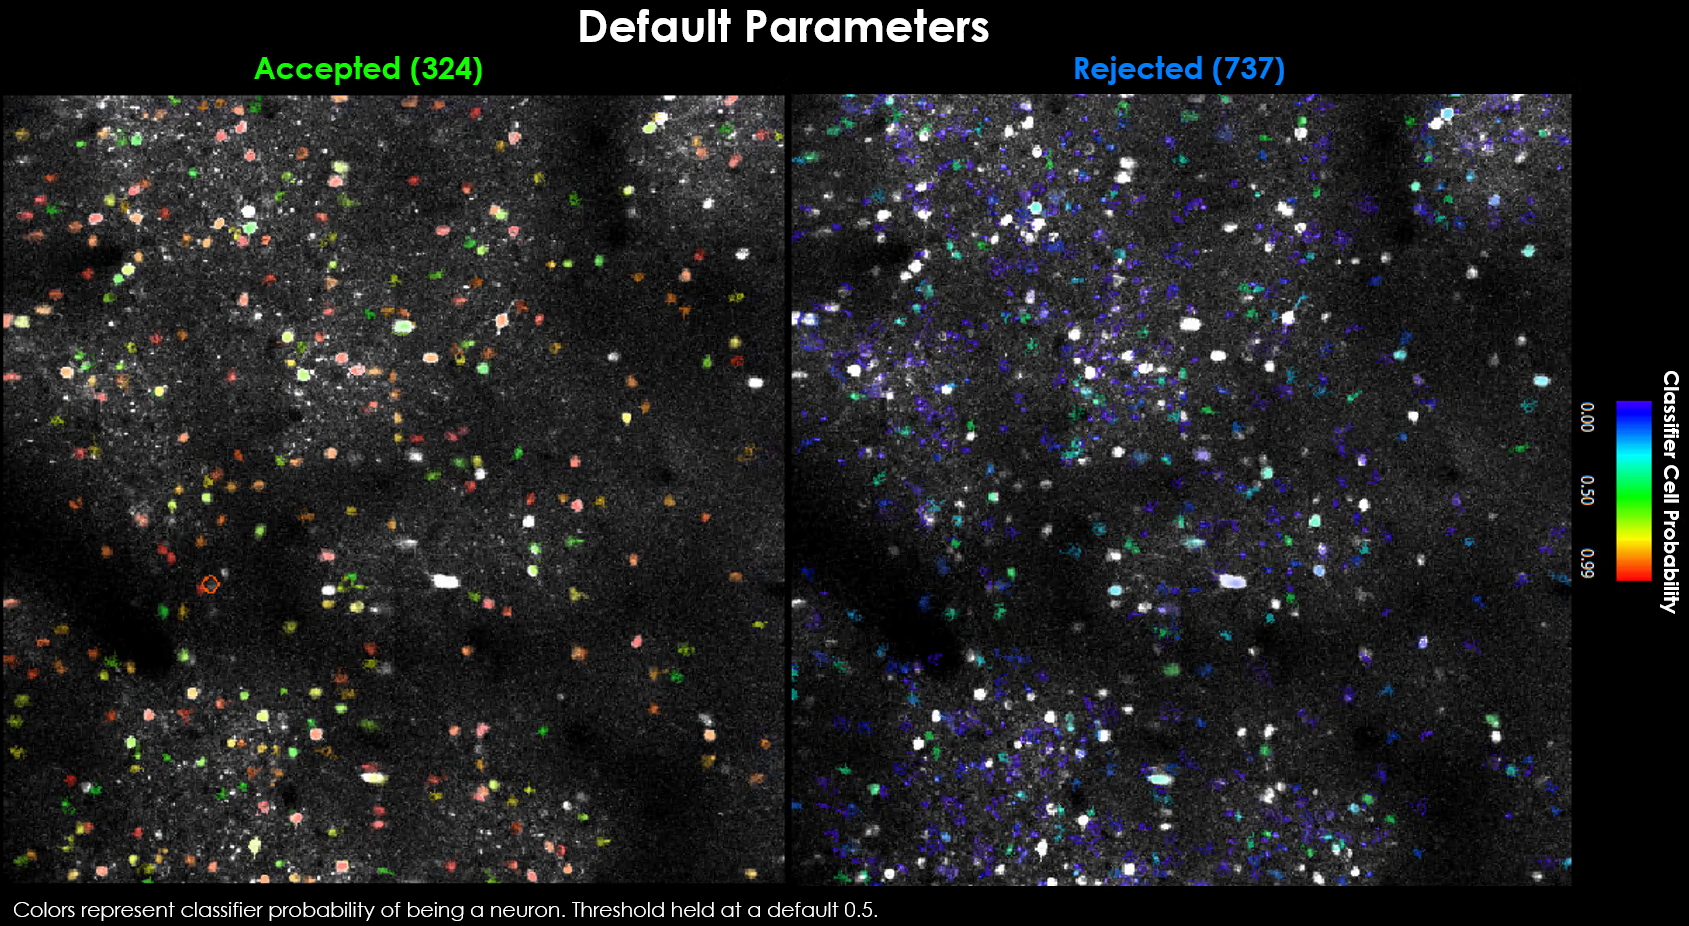
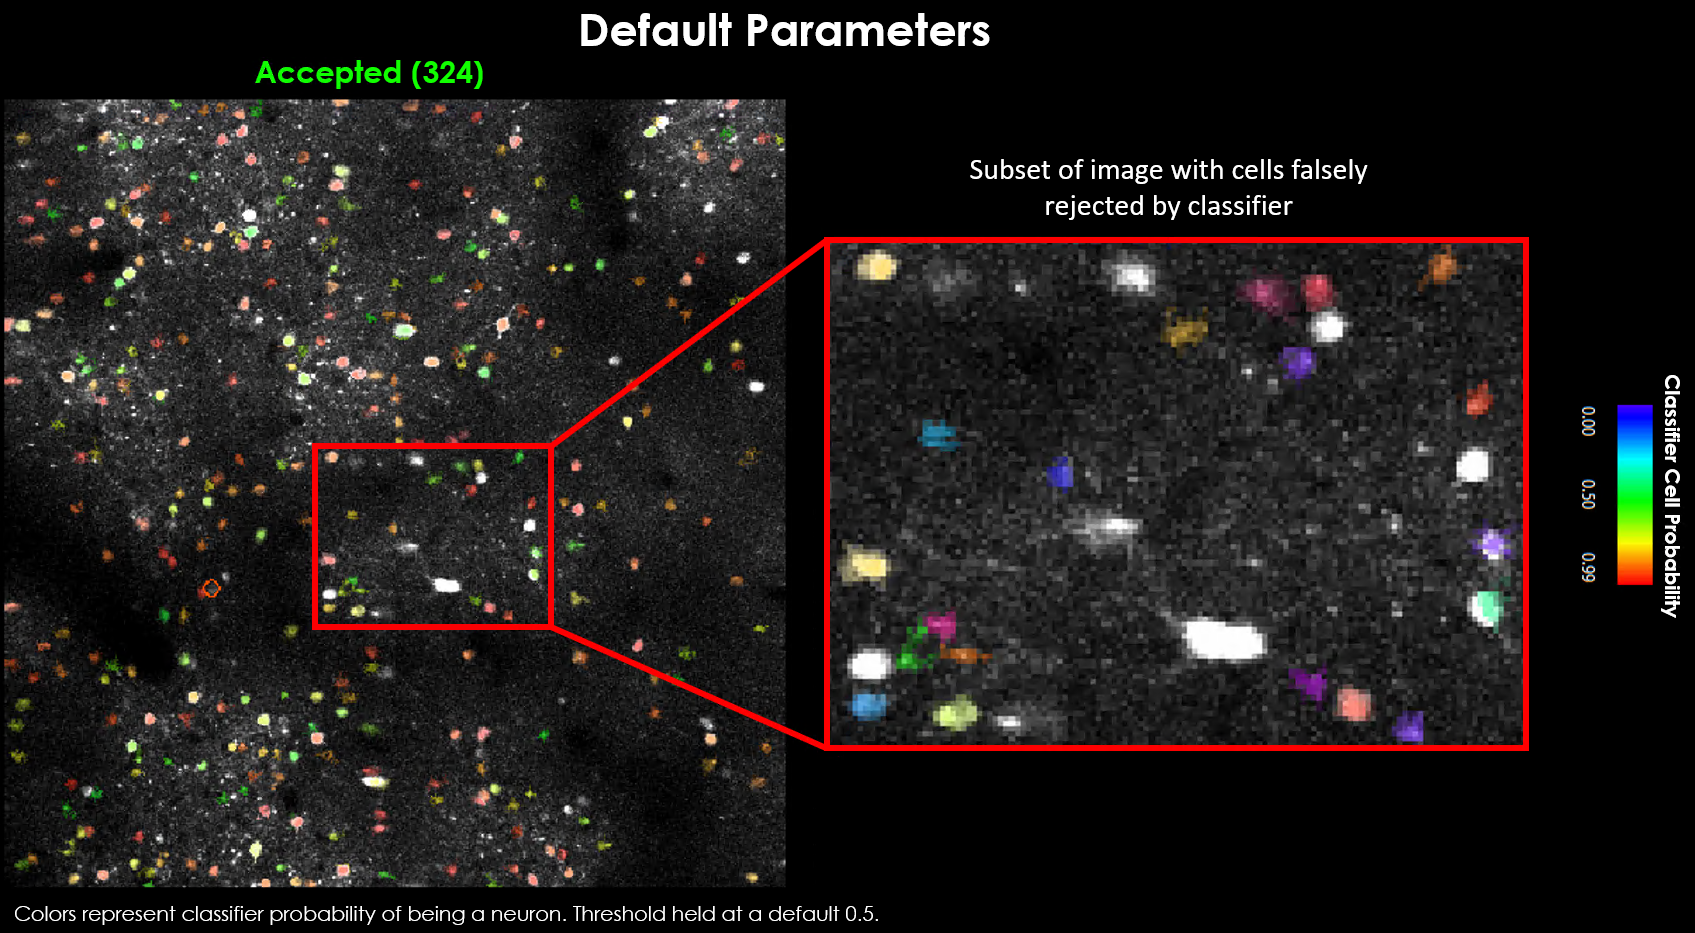
Our default parameters yield 324 accepted and 737 rejected neurons.
Visually it may be evident that we’re missing a few obvious cells.
There are generally 2 approaches toward curating a final dataset.
Approach 1: Tune parameters, thresholds and scaling factors to properly model your dataset Approach 2: Use thresholds that maximize the number of cells detected, and use post-hoc correlation/spatial measures to curate cells
We will discuss both approaches.
First, lets evaluate the effects of raising / lowering the most influencial parameters.
Threshold Scaling#
This is the parameter often described as having the most influence on cell count.
Lowering this value causes more ROI’s to be considered as a “candidate” cell.
However, just because more cells are candidates, does not mean you’re accepted cell count will increase.
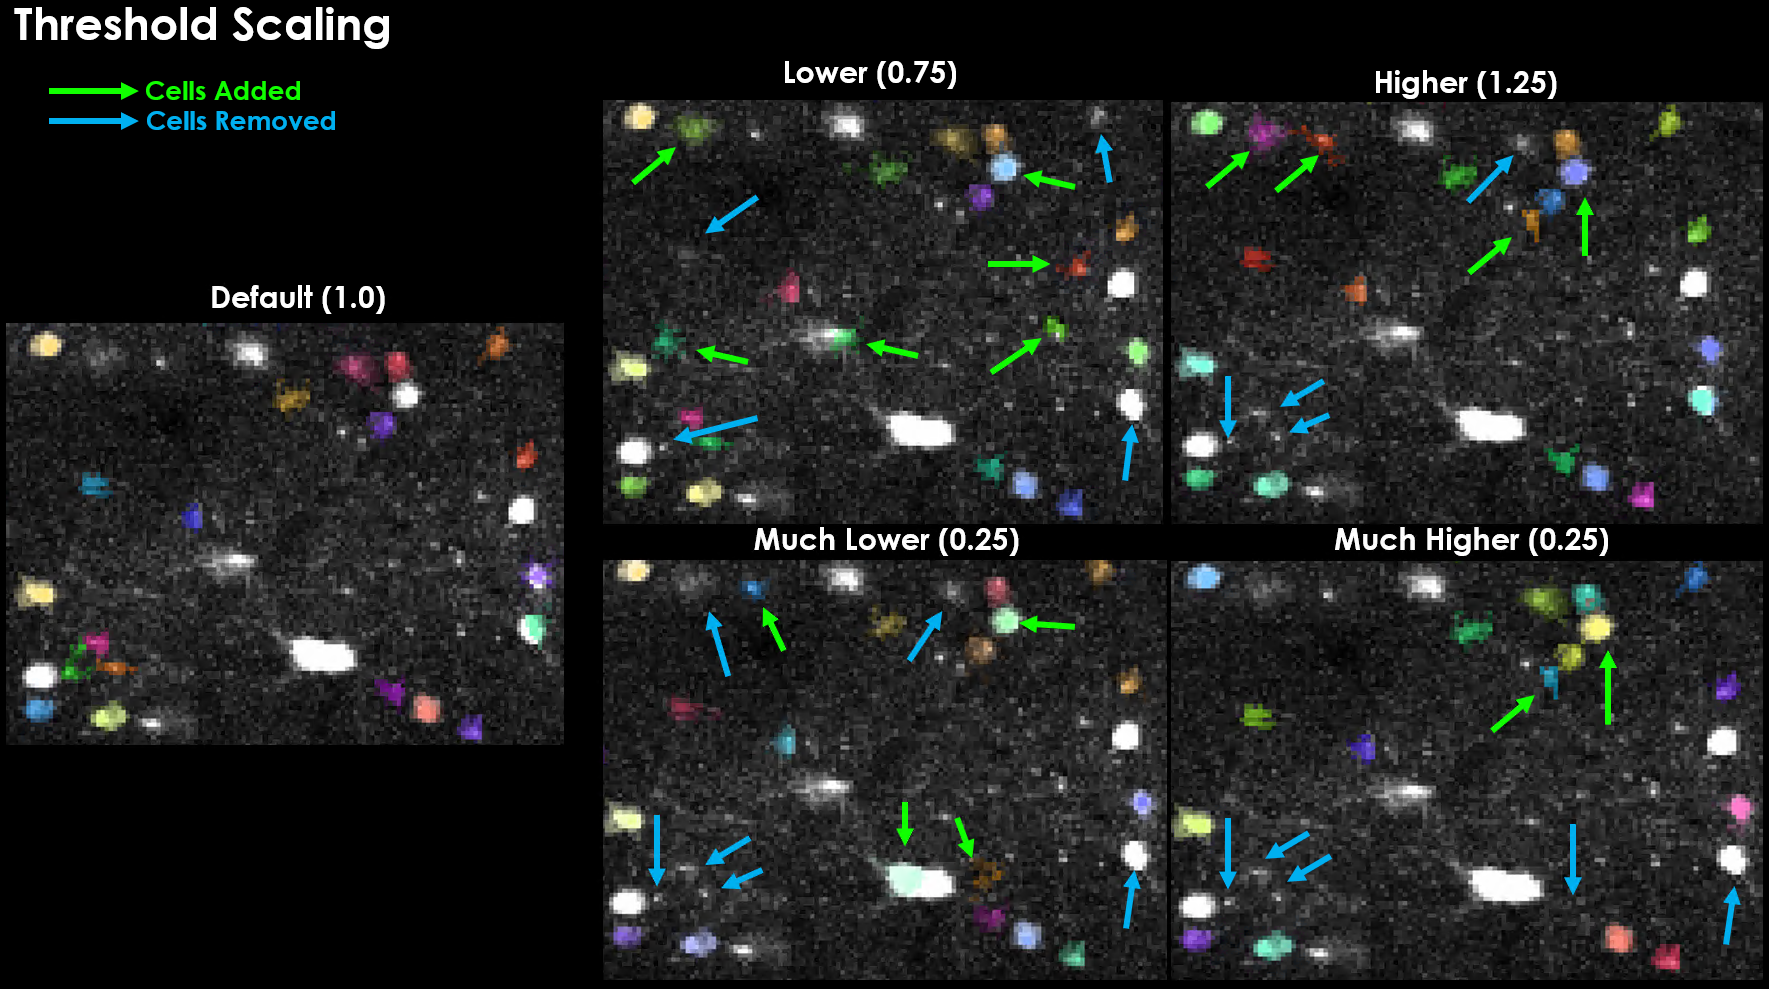
Notably, increasing this threshold actually led to several cells being detected that were not otherwise detected, and vice-versa.
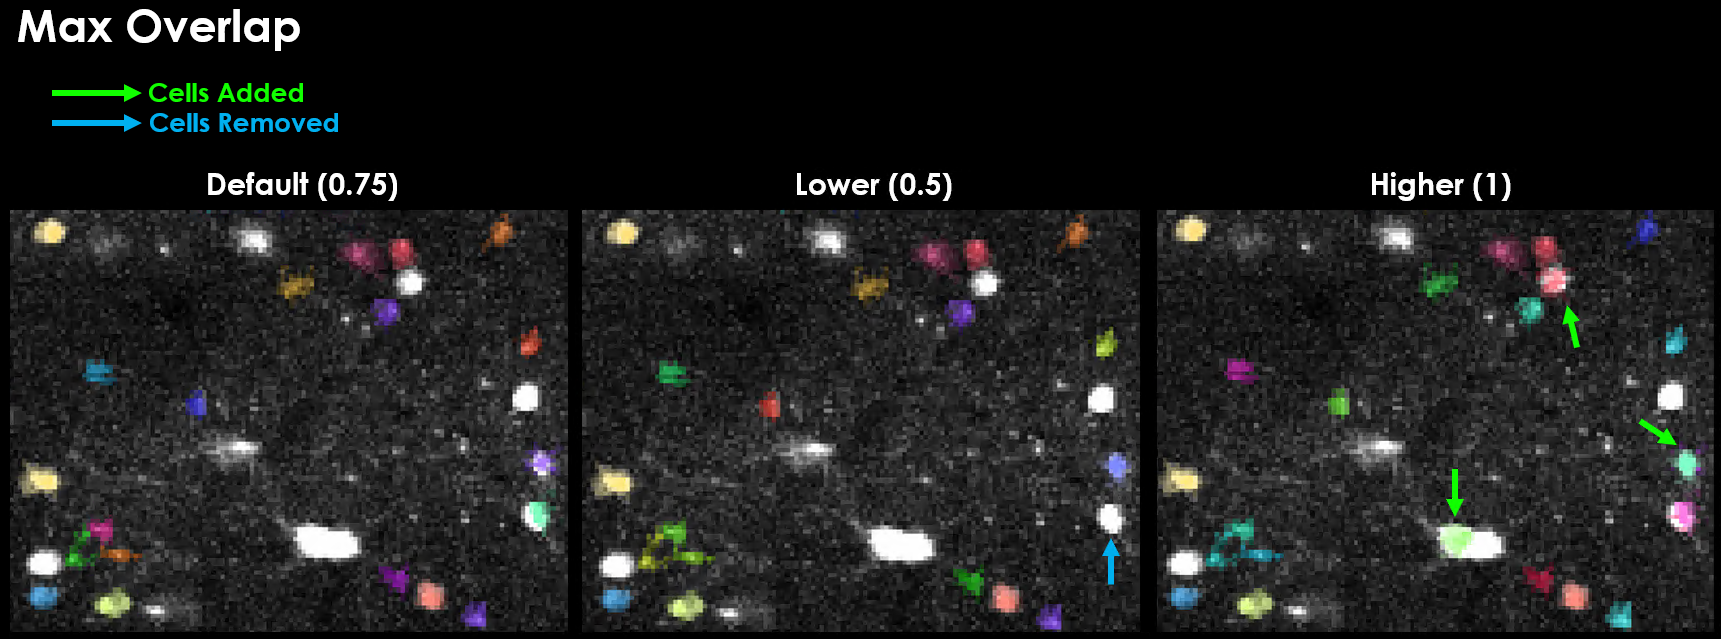
Max Overlap#
If two masks overlap by a fraction >max_overlap, they will be discarded / rejected.
Spatial High-Pass Filter#
There are several steps in the pipeline in which a gaussian filter is applied to the image before a downstream processing step.
spatial_hp_detect is the gaussian filter applied immediately to each mean-subtracted image during cell detection and acts to decrease the background noise.
A good value for spatial_hp_detect will decrease the brightness of the background while increasing the contrast between background and neuron.
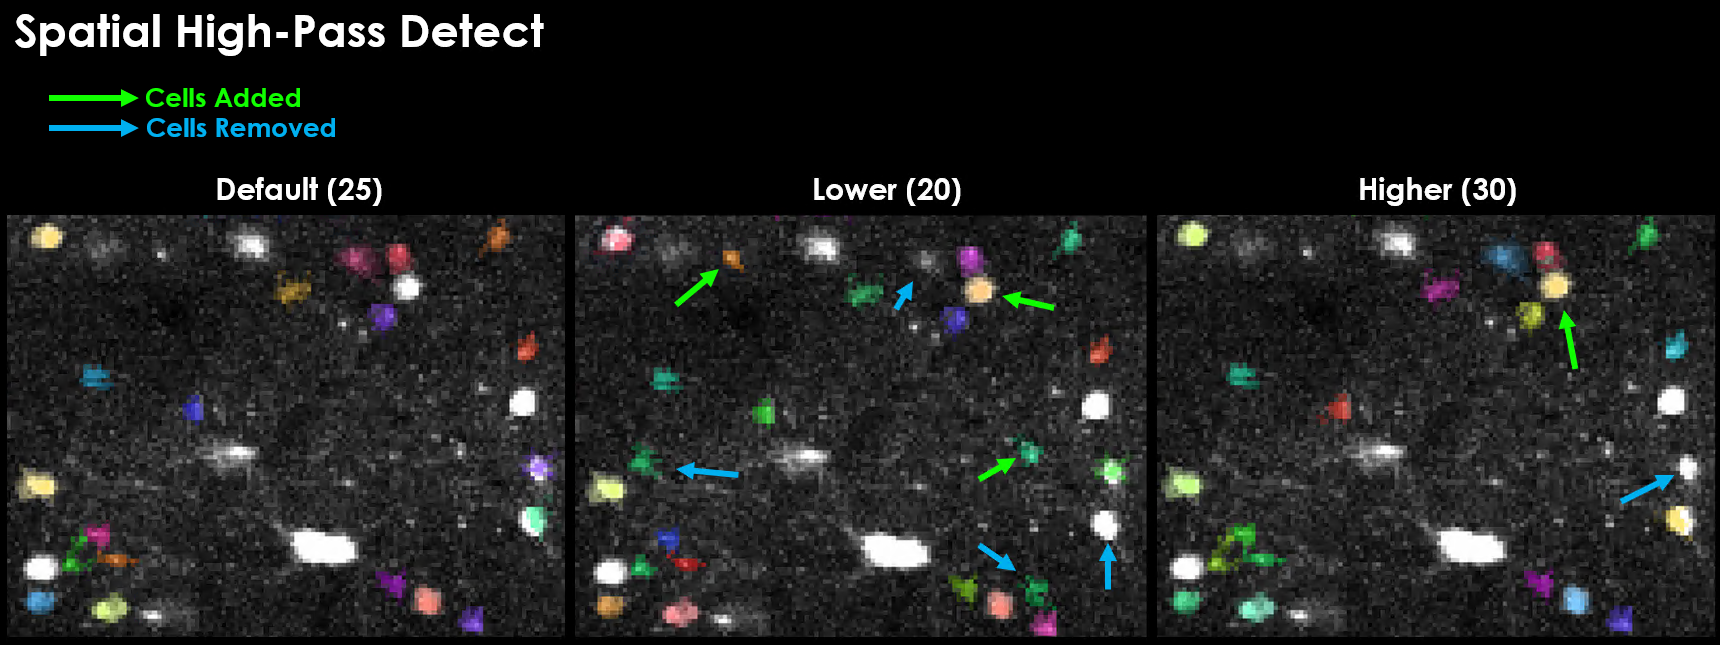
Warning
Physiolocially relevant values for spatial high-pass filters are one of the biggest factors in quality detection. It is additionally very easy to set this value in such a way that 0 cells will be detected. A grid search is likely the most efficient way to test for the best spatial filter size.
Tau#
GCaMP expression is slow, often taking between 100 ms to over 1 second for the signal to rise and decay.
tau is the timescale of the sensor, in seconds.
We need this value because one of the main performance optimizations needed to work with large datasets is binning.
We can bin our data because of this slow timescale, we set the bin-size to our sensors timescale because we expect all frames in this window to be the same (on average), so we can use thos frames as an independant sample for detection.
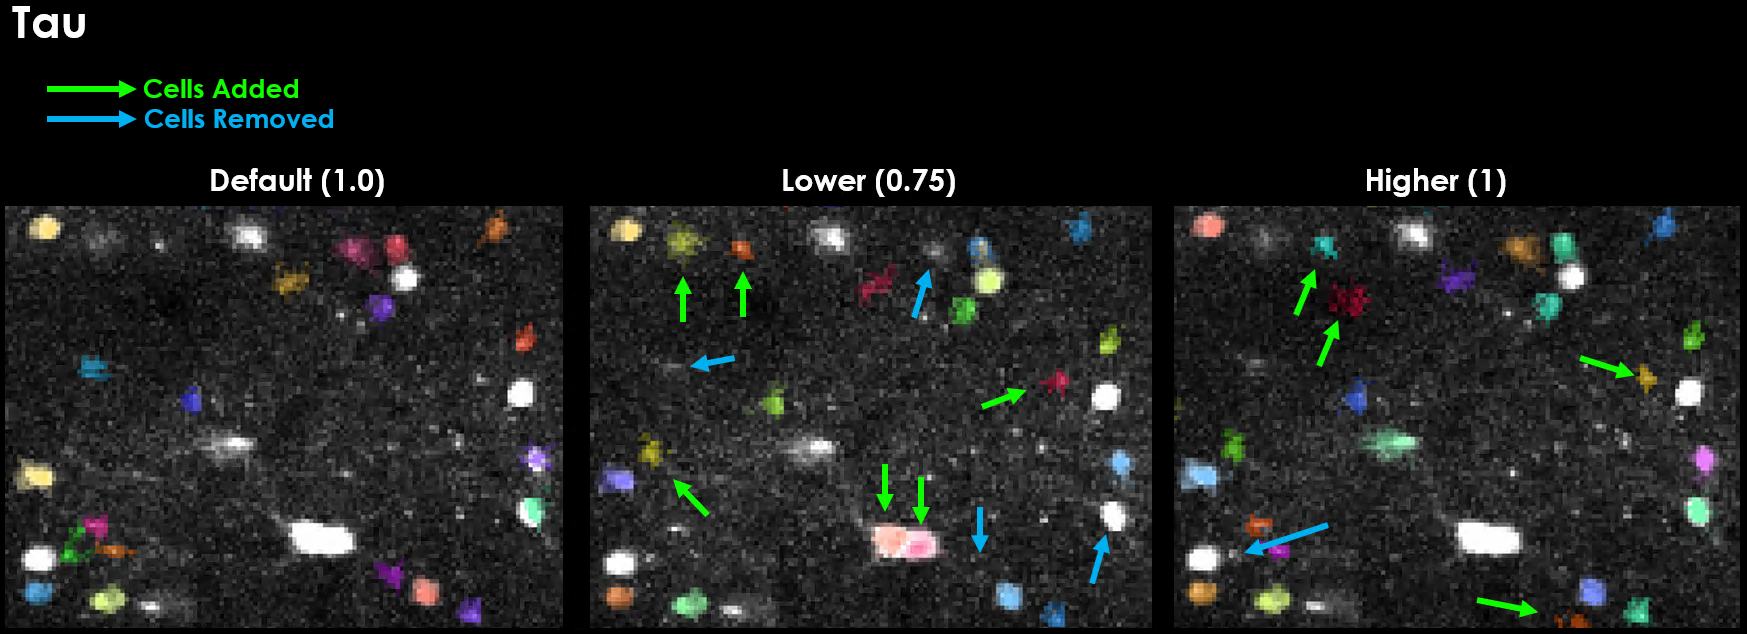
And so, as you can see, changing values of tau has a quite dramatic influence on our segmentation results.
With Tau, when in doubt, round up!
Preview Binned Movie using Tau and Framerate
You can preview the movie as it will be binned like so:
nframes = metadata["num_frames"]
bin_size = int(max(1, nframes // ops["nbinned"], np.round(ops["tau"] * ops["fs"])))

ops = lsp.load_ops(r"./grid_search/registration/two0/plane0/ops.npy")
bin_path = r"./grid_search/registration/two0/plane0/data.bin"

with suite2p.io.BinaryFile(filename=bin_path, Ly=ops["Ly"], Lx=ops["Lx"]) as f:
    binned_data = f.bin_movie(
        bin_size=bin_size,
        bad_frames=ops.get("badframes"),
        y_range=ops["yrange"],
        x_range=ops["xrange"],
    )

fpl.ImageWidget(binned_data).show()
Anatomical Only
skewness - how often do you get an outlier in the pixel activity across time, good for calcium indicators because theyre flat relative to a few events over the course of a recording.