Image Gallery#
Image Assembly#

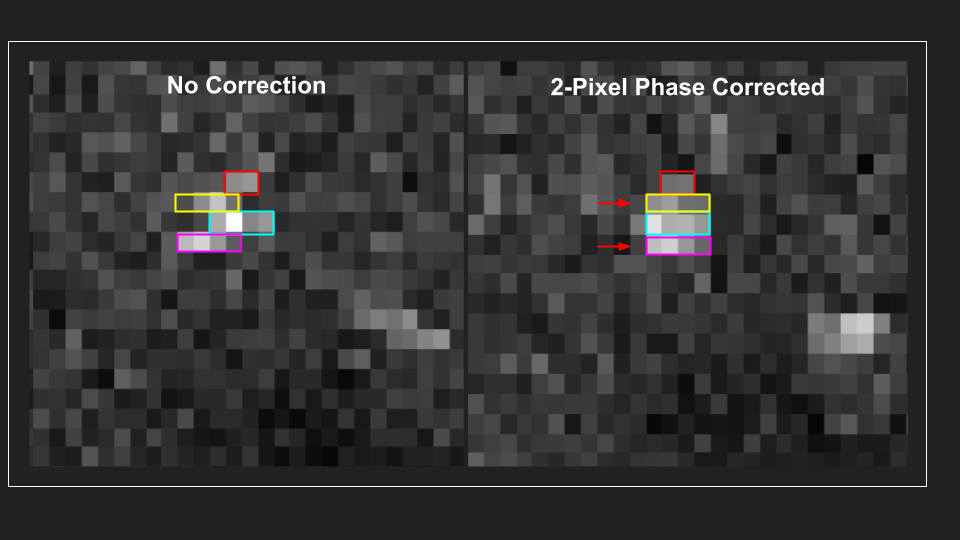
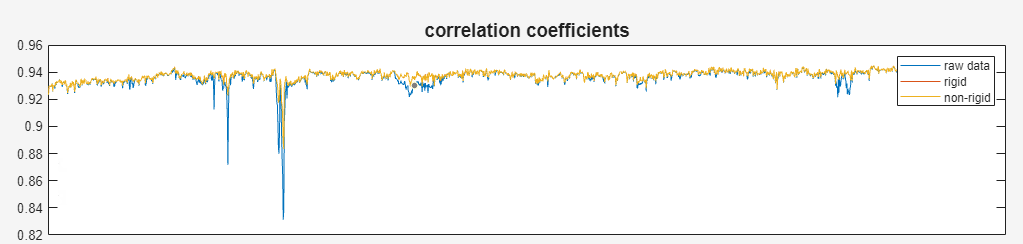
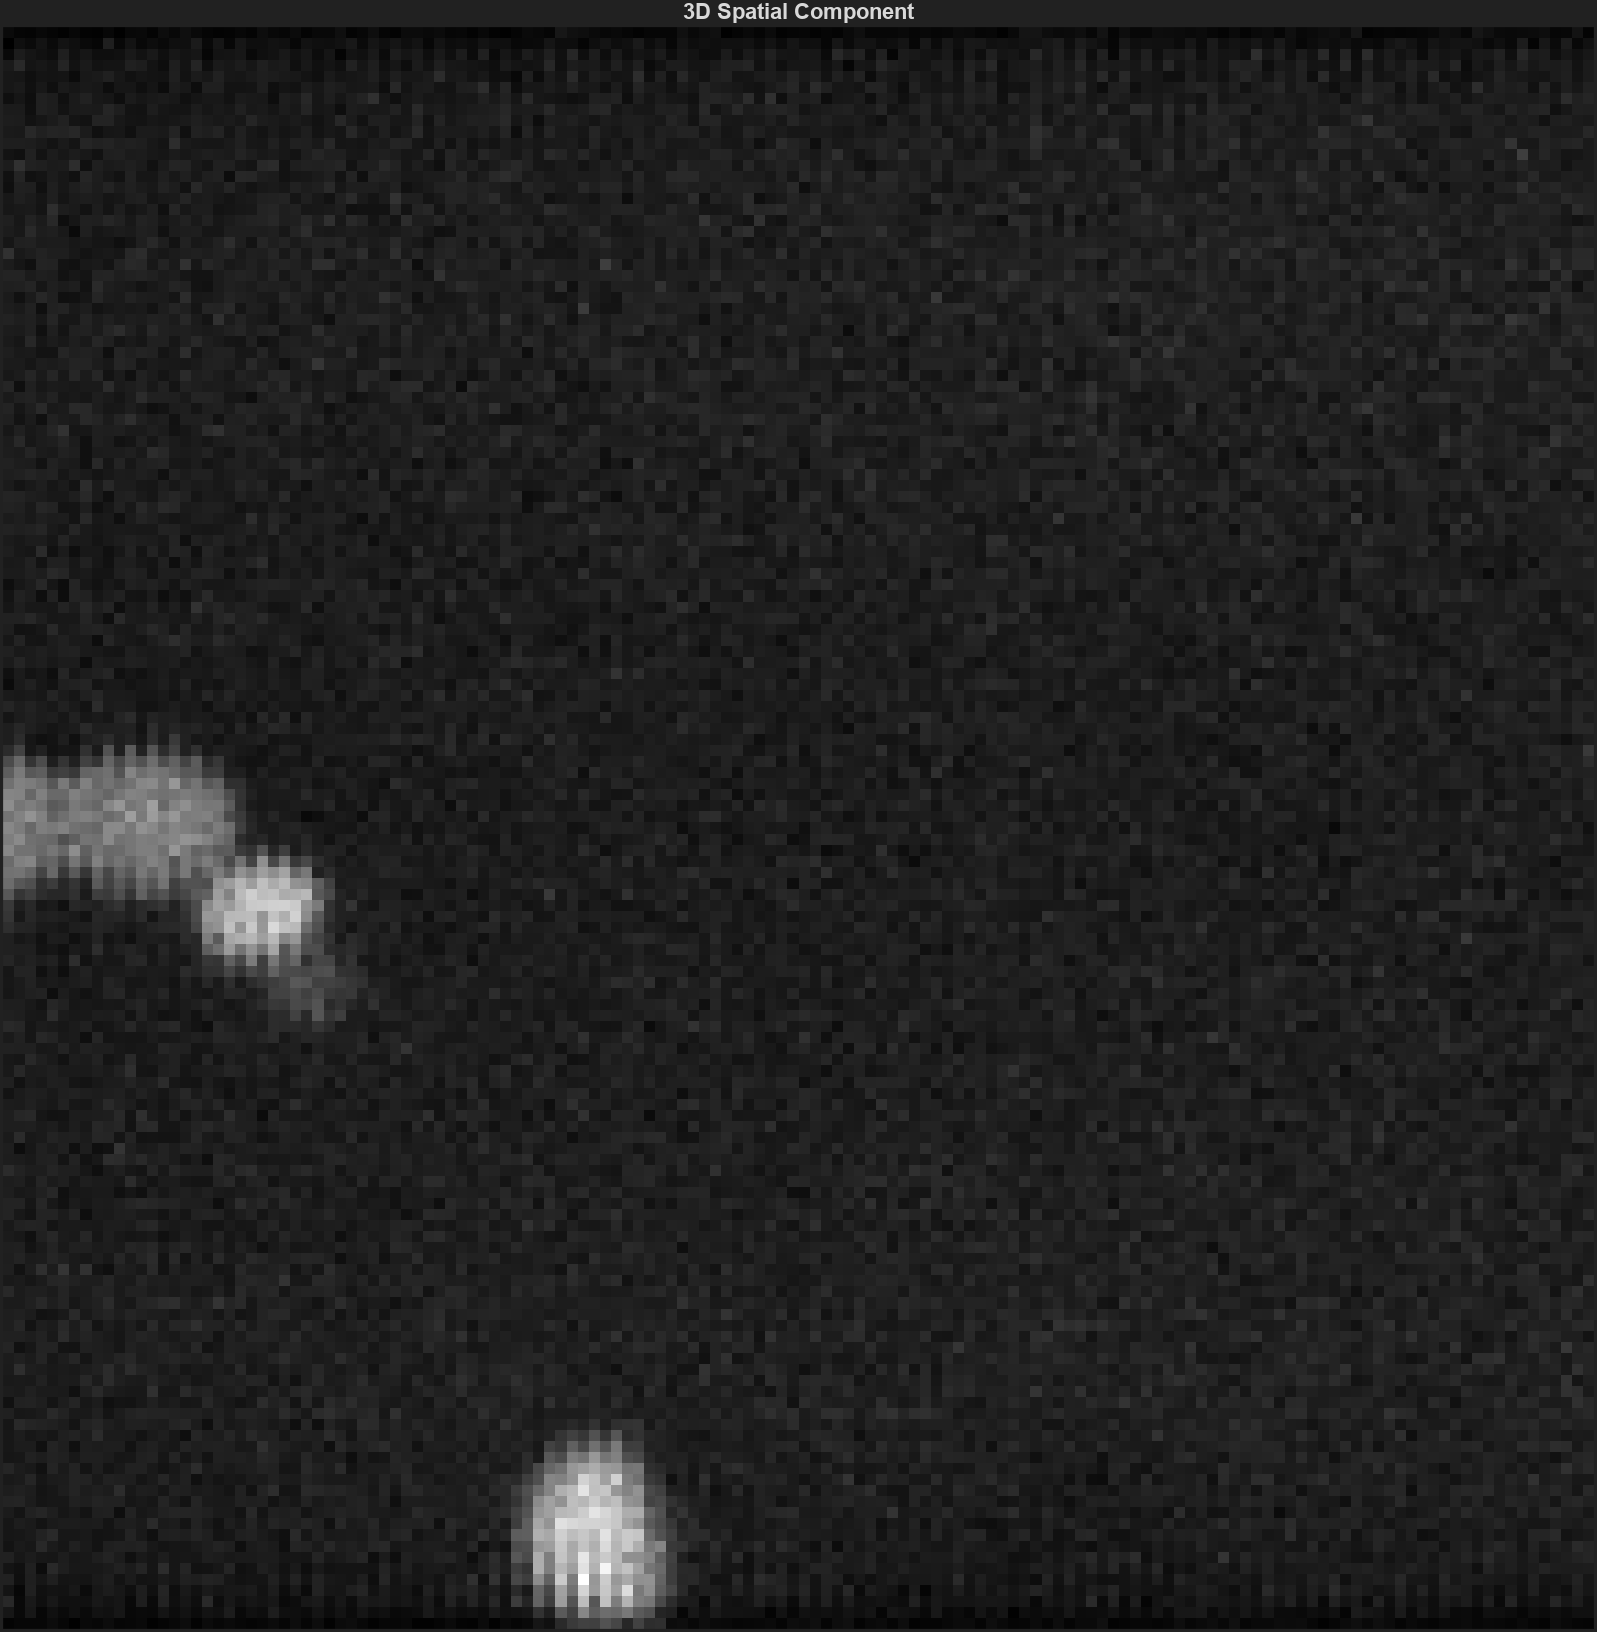
Scan-phase diagram (Remote) :scale: 50 %#
This is the caption of the figure (a simple paragraph).
The legend consists of all elements after the caption. In this case, the legend consists of this paragraph and the following table

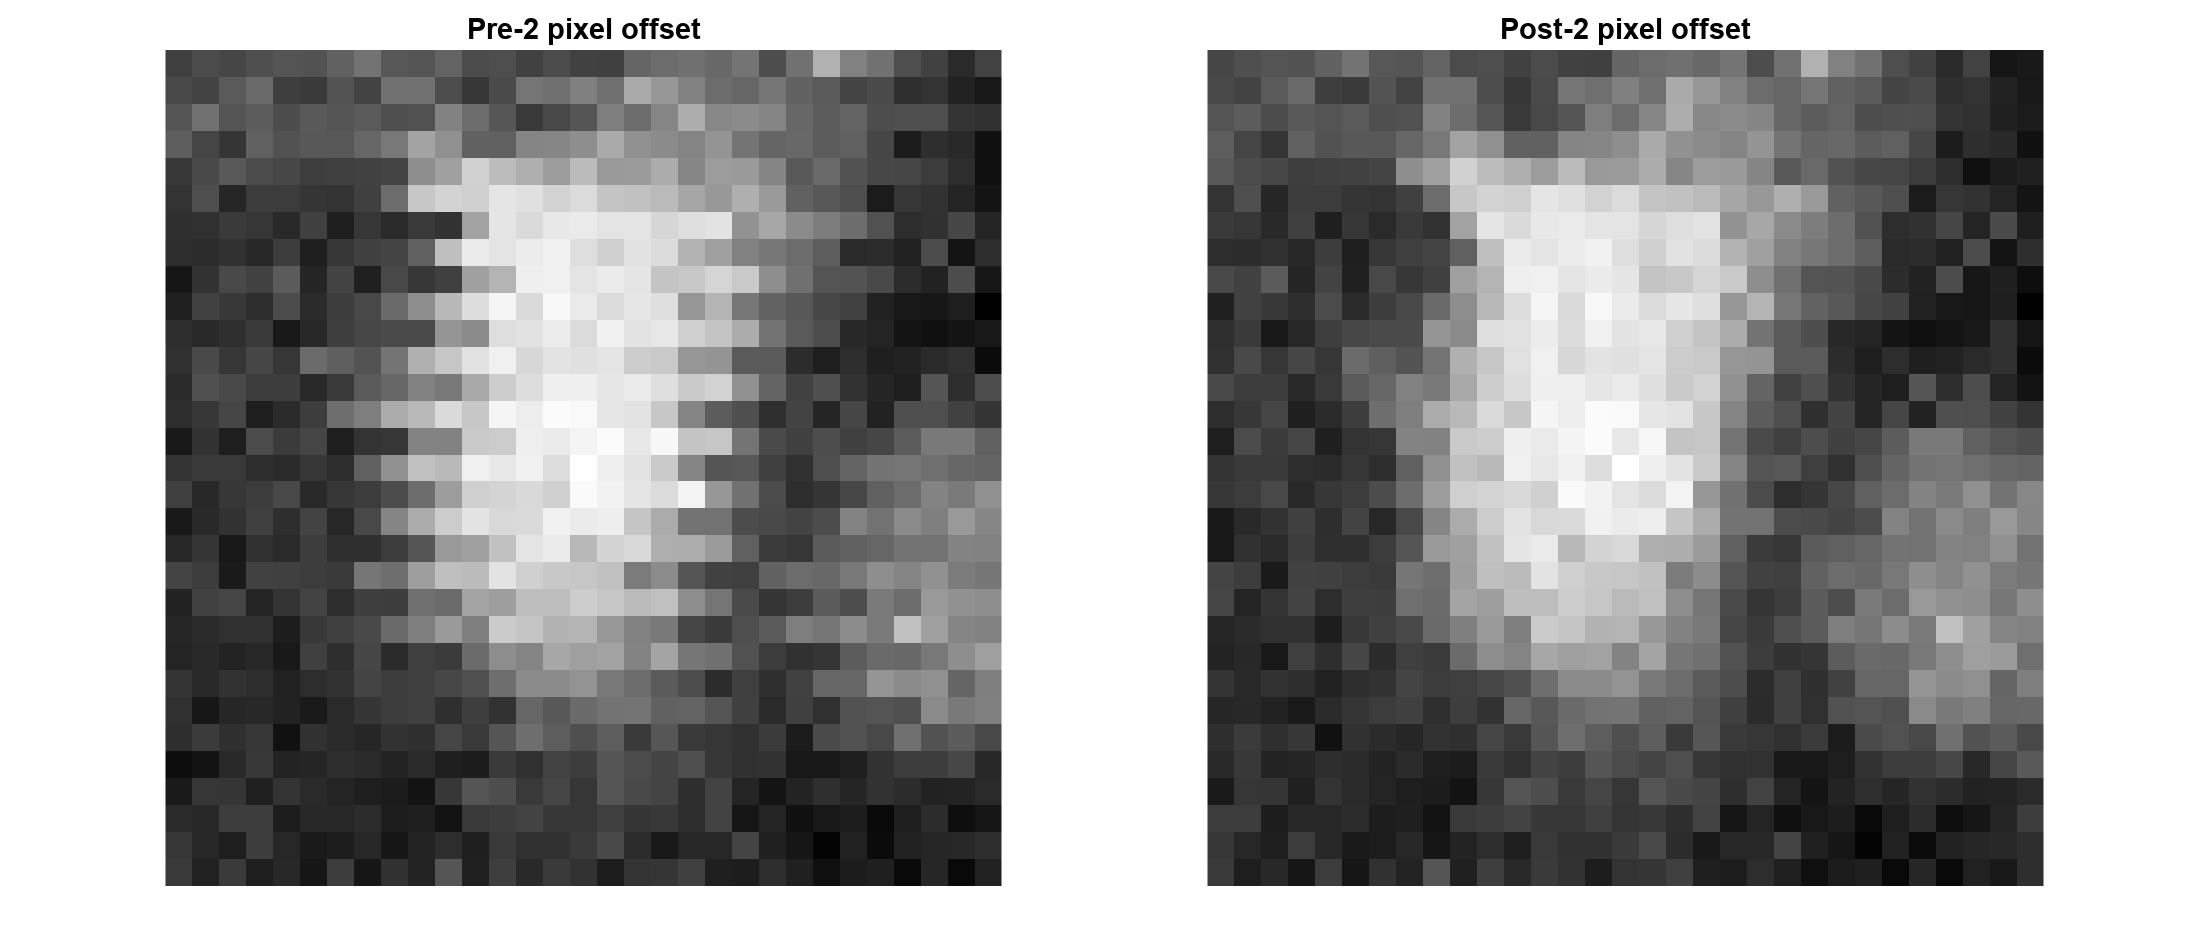
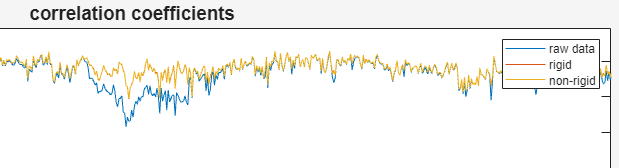
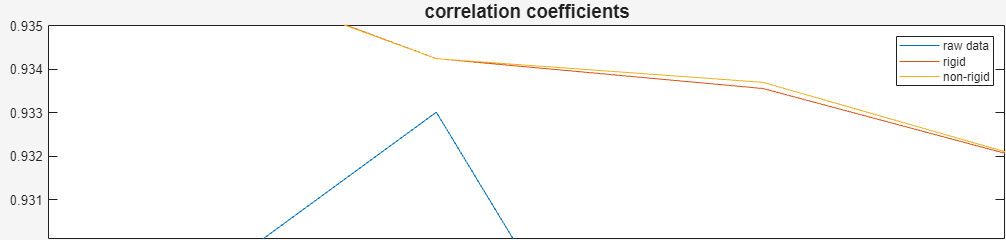
Scan-phase diagram#


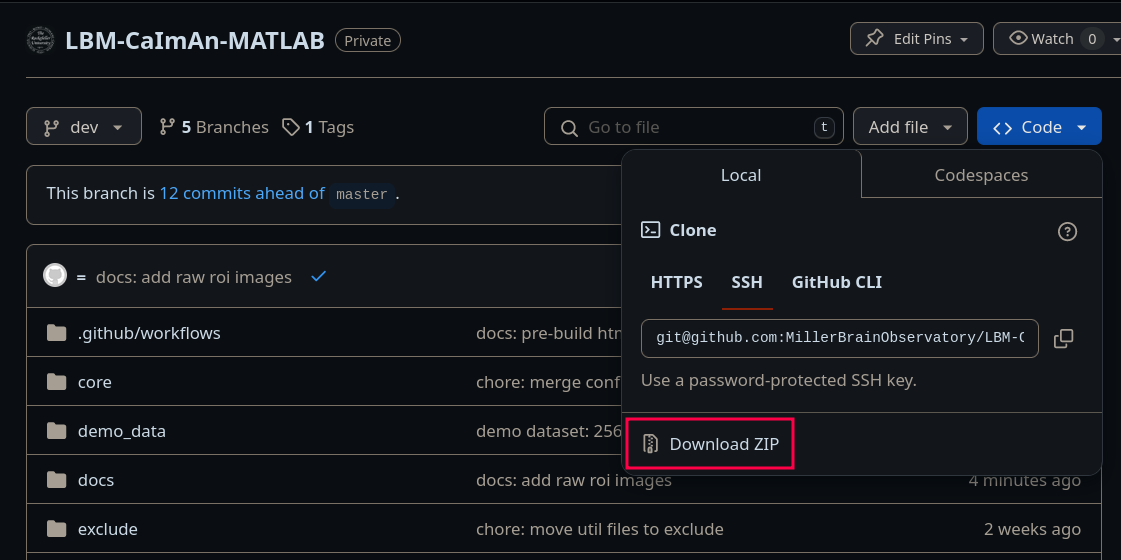
Download project source code.#
Navigate to the github repository site and download the source code via “Download ZIP”. Extract this somewhere on your matlab userpath.