Miller Brain Studio#
Interactive data preview and processing tools for calcium imaging data.
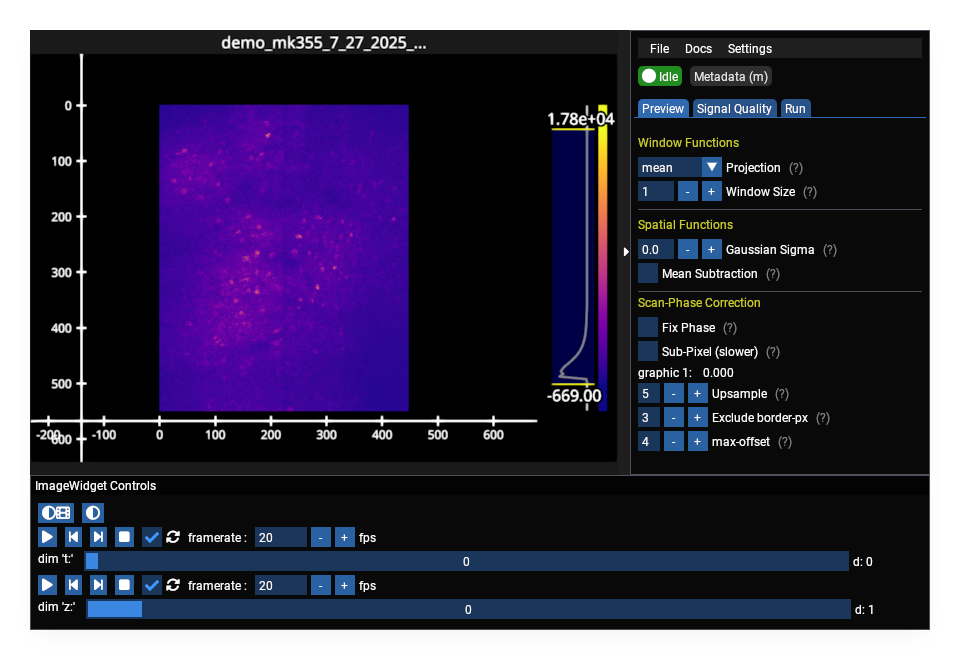
The time-series viewer: image canvas with axes and histogram, plus the side panel (Preview / Signal Quality / Run tabs) for window functions, spatial filtering, scan-phase correction, z-stats, and pipelines.#
Quick Start#
uv pip install mbo_utilities
mbo                    # opens file dialog
mbo /path/to/data      # opens specific file
mbo /path --metadata   # metadata only
From Python:
from mbo_utilities.gui import run_gui

run_gui("/path/to/data")

# or from a numpy array
import numpy as np
data = np.random.rand(100, 512, 512)
run_gui(data)
If no input is provided and Qt is available, a file dialog opens automatically.
Opening Data#
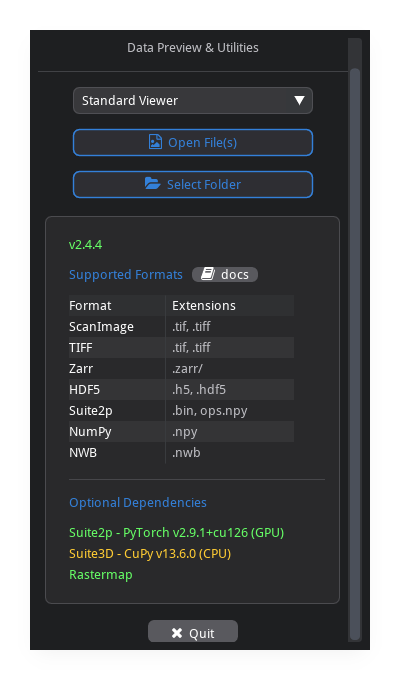
Open File vs Select Folder#
Open File(s) (
o): select one or more tiff files. loads exactly the file(s) you pick — nothing else in the directory is touched.Select Folder (
Shift+O): scans the directory and loads all compatible files. the reader auto-detects the format from the first file and filters out incompatible files (e.g. previously saved outputs or unrelated TIFFs are excluded).
Supported Formats#
Format |
Description |
|---|---|
|
raw ScanImage, BigTIFF, OME-TIFF, ImageJ hyperstacks |
|
zarr v3 arrays |
|
suite2p binary format |
|
HDF5 files |
|
numpy arrays (memory-mapped) |
Load Options#
Option |
Description |
|---|---|
Separate ScanImage mROIs |
split multi-ROI acquisitions into separate panels |
Enable Threading |
parallel z-stats computation on load |
Enable Data Preview Widget |
full preview with window functions and controls |
Metadata Preview Only |
show only metadata, skip image rendering |
Viewers#
The GUI selects a viewer automatically based on the data type.
Time-Series Viewer#
The default viewer for calcium imaging data (TZYX). Used for ScanImage TIFFs, standard TIFFs, ImageJ hyperstacks, and other volumetric data.
Features:
temporal projections (mean, max, std) over a sliding window
spatial filtering (gaussian blur, mean subtraction)
scan-phase correction for bidirectional raster scanning
frame averaging for piezo z-stacks
z-stats signal quality analysis
suite2p pipeline integration
Pollen Calibration Viewer#
Specialized viewer for LBM beamlet calibration data (stack_type == "pollen"). Automatically selected when pollen calibration data is loaded.
Features:
automatic bead detection via cross-correlation
manual interactive calibration (click-to-mark beads)
cavity A/B discrimination for dual-cavity LBM
result visualization with XY position and offset plots
previous calibration result loading from H5 files
Navigation#
Keyboard Shortcuts#
Key |
Action |
|---|---|
Navigation |
|
|
previous / next frame (T) |
|
previous / next z-plane (Z) |
|
jump 10 frames |
|
jump 10 z-planes |
File |
|
|
open file |
|
open folder |
|
save as |
View |
|
|
toggle metadata viewer |
|
toggle side panel |
|
reset contrast (vmin/vmax) |
|
toggle auto-contrast on z-change |
Help |
|
|
open help |
|
keybinds cheatsheet |
Press k in the GUI to see this list at any time.
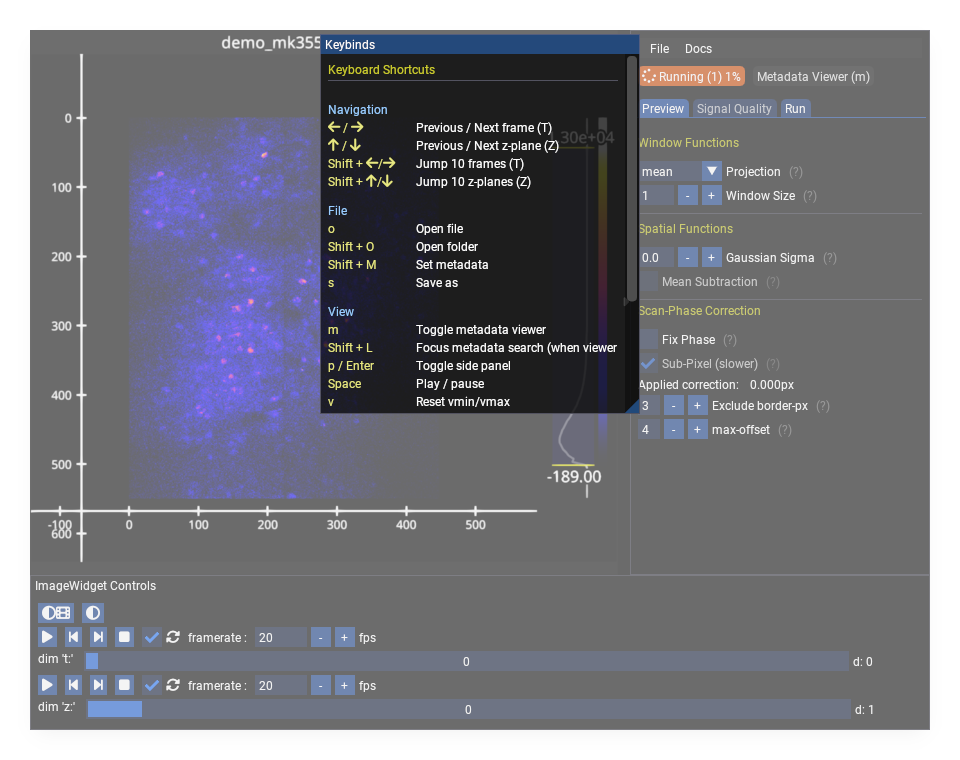
The in-app shortcut cheatsheet, opened with k.#
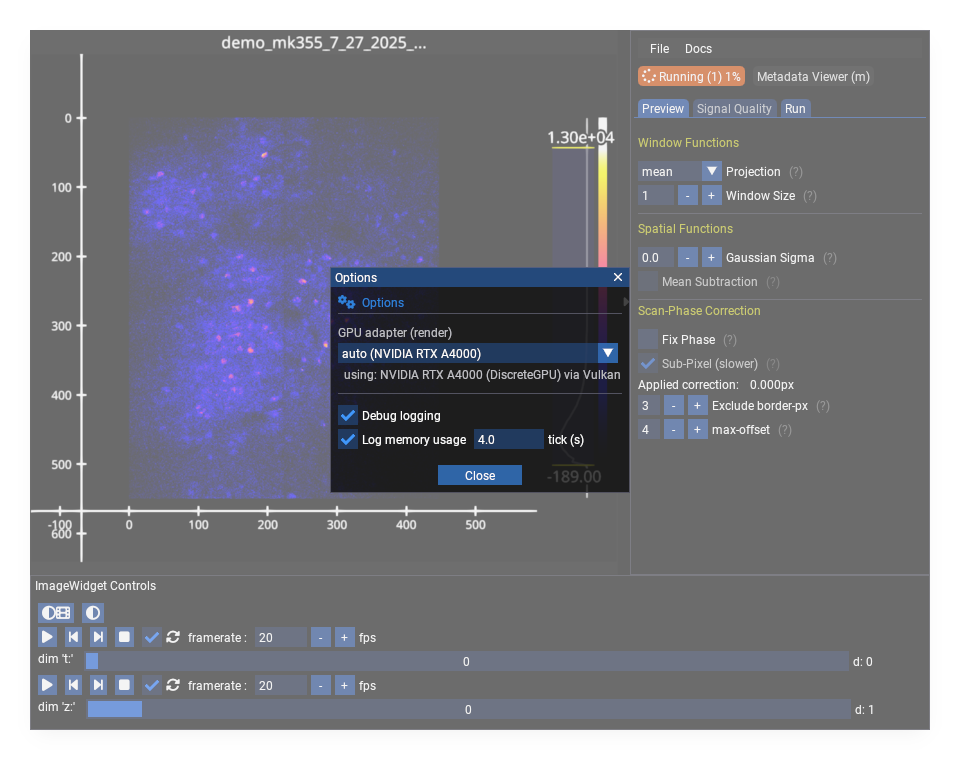
Options#
File > Options sets the render GPU adapter, debug logging, and memory-usage logging.
Preview Controls#
Window Functions#
Apply temporal projections over a sliding window of frames.
Function |
Description |
|---|---|
mean |
average intensity over window |
max |
maximum intensity projection |
std |
standard deviation over window |
Parameters:
Window Size: number of frames to include (3-20 recommended)
Gaussian Sigma: spatial gaussian filter (0 = disabled)
Mean Subtraction: subtract per-z-plane mean image to highlight activity. requires z-stats to finish computing first.
Scan-Phase Correction#
Preview bidirectional raster-scan phase correction before saving. Only available for ScanImage data.
Parameter |
Description |
|---|---|
Fix Phase |
enable/disable correction |
Sub-Pixel |
FFT-based sub-pixel correction |
Upsample |
sub-pixel precision factor (1/N pixel) |
Exclude border-px |
exclude edge pixels from correlation |
max-offset |
limit allowed pixel offset |
Workflow:
view mean or mean-subtracted projection (window 3-15)
toggle Fix Phase on/off to compare
adjust border-px and max-offset if needed
toggle Sub-Pixel for further improvement
adjust Upsample factor (2-3 typical)
Frame Averaging#
Available for piezo z-stack data. When frames_per_slice > 1, toggle averaging based on ScanImage’s logAverageFactor. This changes the effective shape of the data.
Metadata Viewer#
Toggle with m or the Metadata button in the status bar.
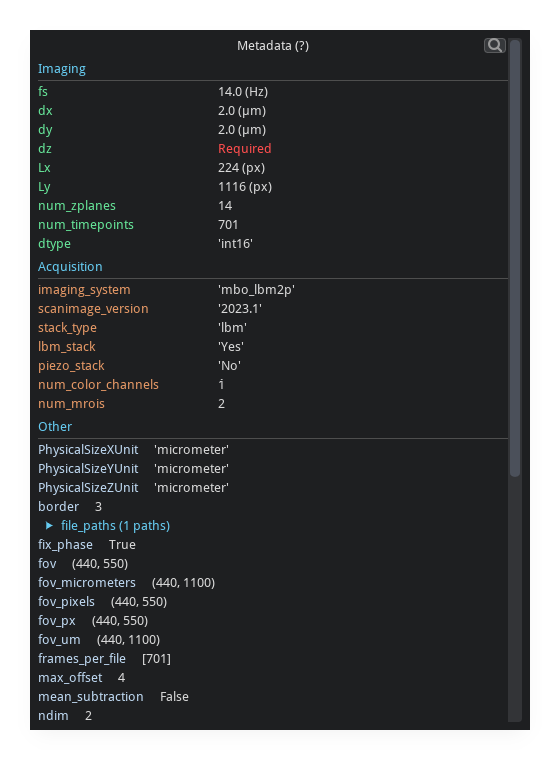
Displays all metadata attached to the current array, including ScanImage headers, dimension tags, and user-supplied fields.
Z-Stats#
Per-z-plane signal quality statistics, computed in the background on load.
Metrics#
Metric |
Description |
|---|---|
Mean |
average fluorescence intensity |
Std |
standard deviation |
SNR |
signal-to-noise ratio (mean / std) |
Visualization#
The z-stats panel adapts to the data:
single z-plane: stats table with bar chart
2 z-planes: grouped bar charts (Z1 vs Z2)
many z-planes: line plots with error bars and z-plane signal profiles
multiple ROIs: combined per-ROI profiles with mean +/- std shading
Saving Data#
Open via File > Save As or press s.
The filename, estimated size, and output shape update live as you change the format and the timepoint/plane selection.#
Important: Save As Does Not Change the Active Dataset#
Save As exports a copy of the data to a new file. The viewer continues to display the original dataset. Any subsequent operations (Suite2p, further saves) still use the original data.
To work with the saved file, open it explicitly via File > Open File.
Output Formats#
Format |
Description |
|---|---|
|
BigTIFF with ImageJ/OME metadata |
|
zarr v3 (recommended for large data) |
|
suite2p binary format |
|
HDF5 |
Selection#
The save dialog provides dimension-specific subsetting:
Timepoints:
start:stop:stepsyntax with optional exclusion rangesZ-planes: range and step selection
Channels: multi-channel selection (when applicable)
Output suffix: custom suffix appended to filename
An output preview shows the filename, estimated size, and output shape before saving.
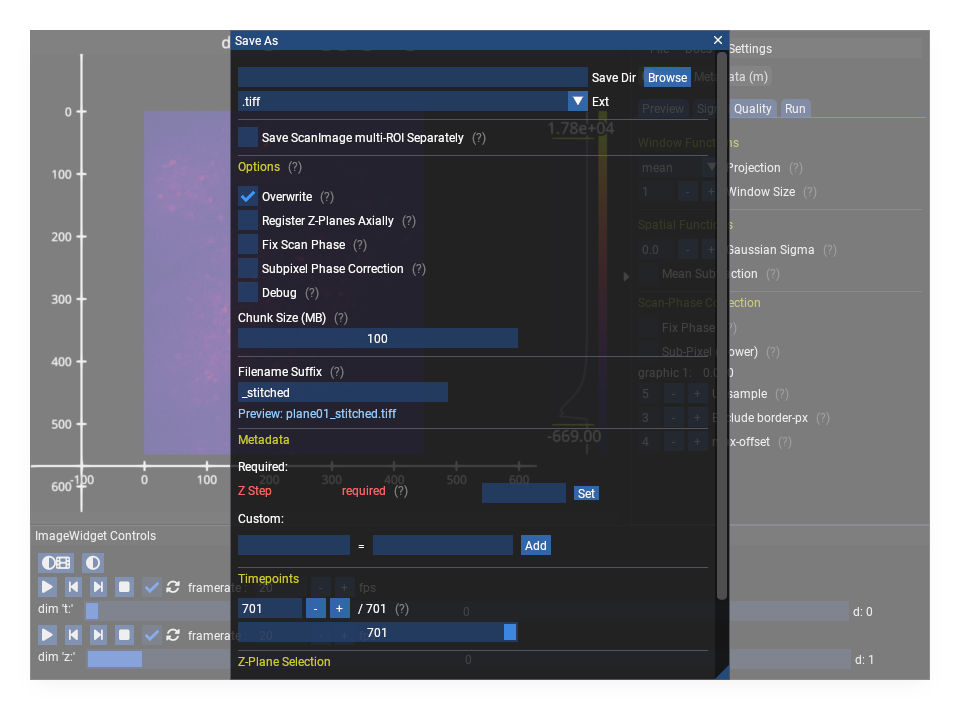
Options#
General write options (.tiff shown). Format-specific sections appear below as you change the output extension.#
Option |
Description |
|---|---|
Run in Background |
save without blocking the GUI |
Overwrite |
replace existing output files |
Fix Scan Phase |
apply phase correction on write |
Subpixel Correction |
FFT-based phase correction on write |
Register Z-Planes |
axial (plane-to-plane) phase-correlation registration |
Chunk Size (MB) |
memory chunk size for writing |
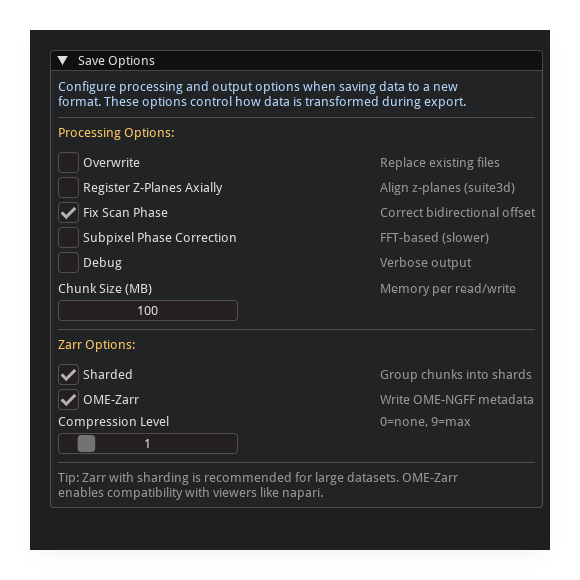
Zarr-Specific Options#
Option |
Description |
|---|---|
Sharding |
enable zarr sharding for faster access |
OME-Zarr |
write OME-Zarr compliant metadata |
Compression Level |
zstd compression level (0 = none) |
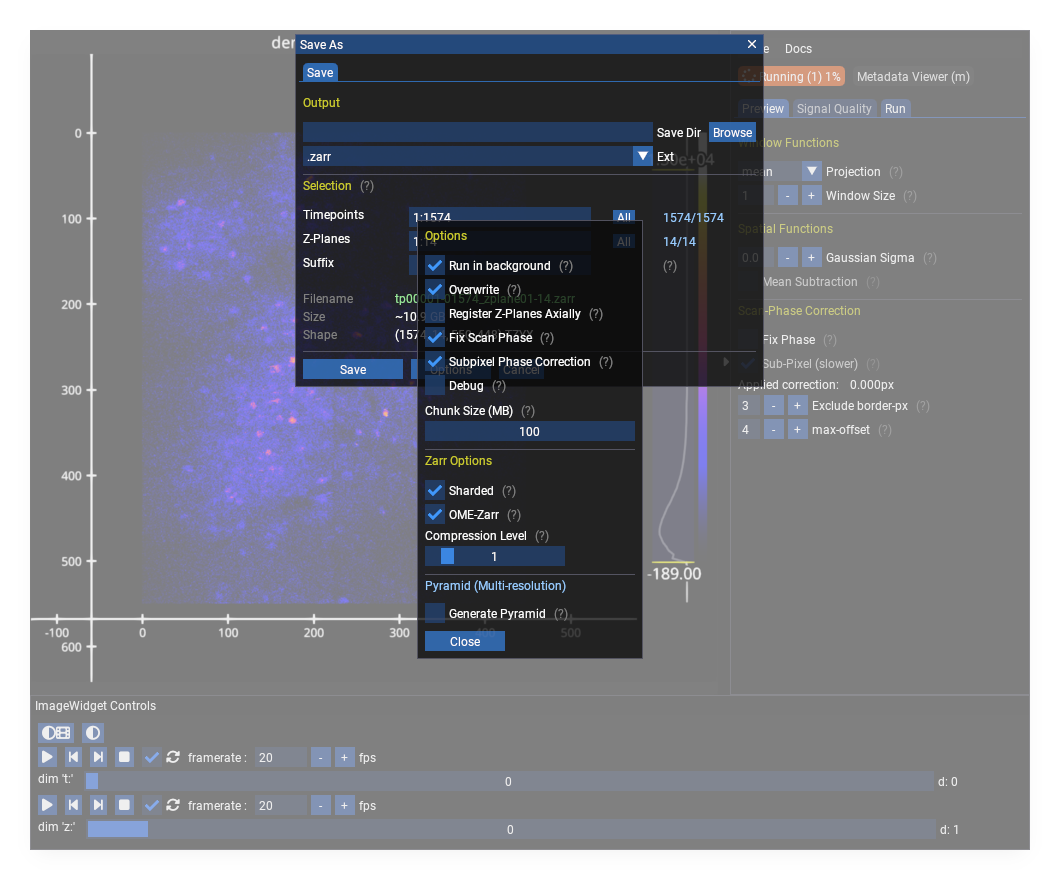
Pyramid |
generate multi-resolution pyramid |
Pyramid Layers |
max number of downsampled levels |
Video (.mp4) Options#
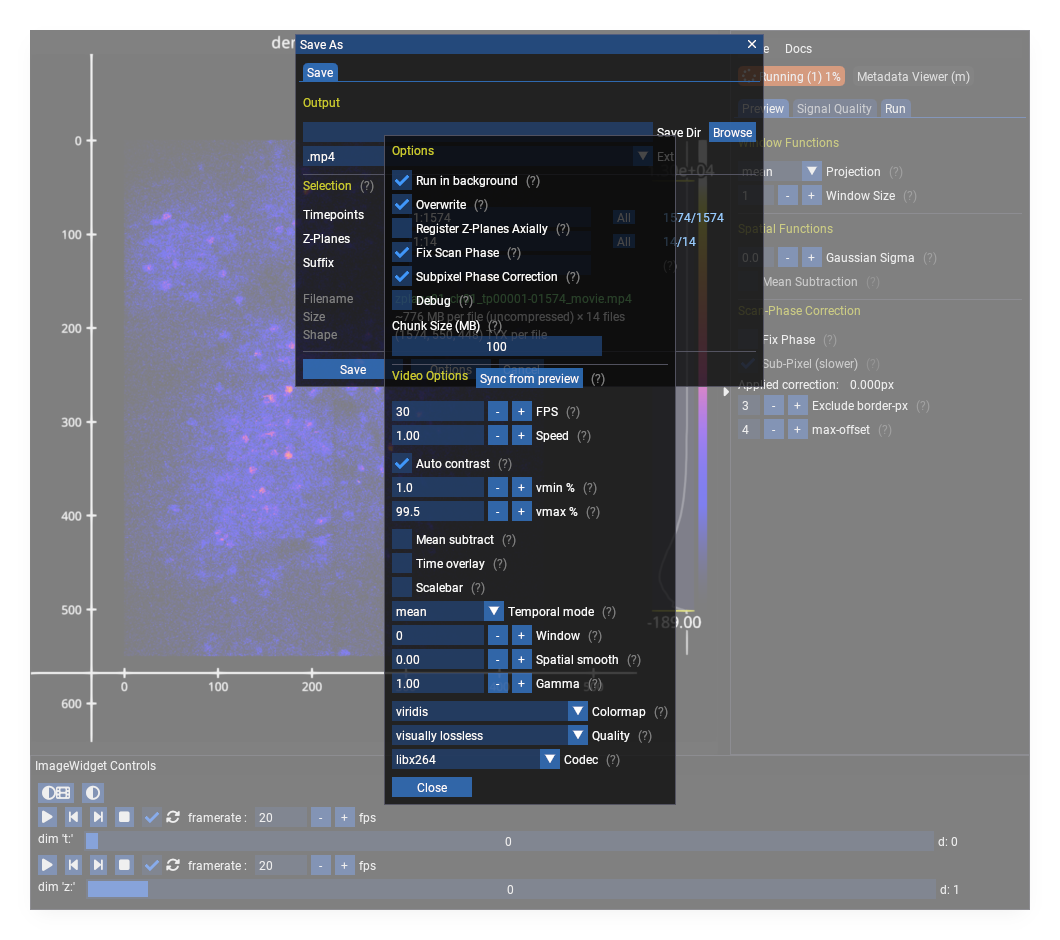
Exporting to .mp4 exposes playback and rendering controls: frame rate, speed factor, contrast percentiles, temporal/spatial smoothing, gamma, colormap, quality, and codec.
Metadata#
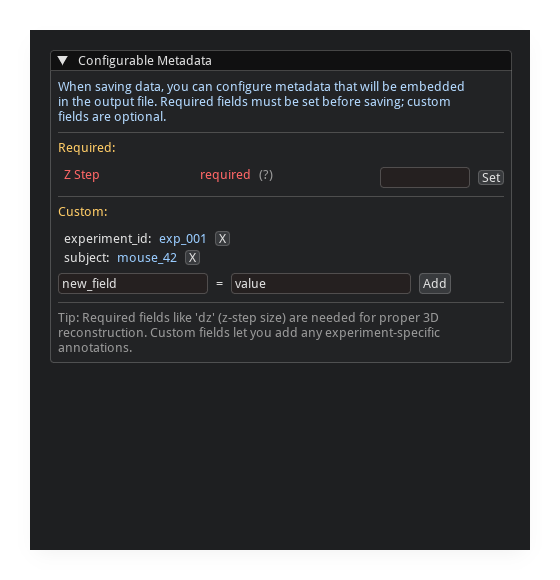
The save dialog includes a metadata editor:
suggested fields are auto-populated from the array
fields can be auto-detected from the filename
custom key/value pairs can be added
missing recommended fields are highlighted
Process Manager#
Click the status indicator in the menu bar to open the process console.
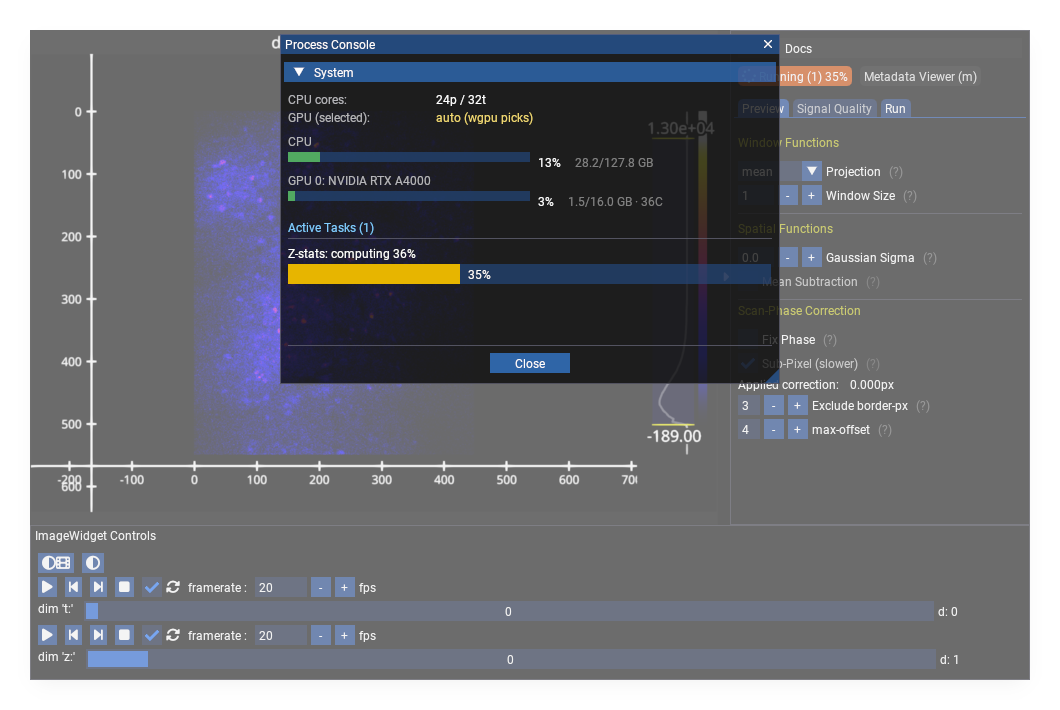
The status indicator is color-coded:
green: idle or completed
orange: task running (with progress percentage)
red: error
The process console shows:
active tasks: in-app progress (save, z-stats, registration)
background processes: external processes with PID, elapsed time, and status
per-process log output (color-coded, collapsible)
kill / dismiss / copy controls
Suite2p Integration#
The Run tab: dataset summary, output folder, plane/timepoint slicing, scan-phase options, and the pipeline selector. Parameters and settings > Open reaches the full parameter dialog.#
Available when suite2p is installed. Access via the processing pipeline panel.
Suite2p always runs on the dataset currently loaded in the viewer. If you used Save As to export a processed file and want to run Suite2p on that file, you must open it first with File > Open File.
run suite2p on selected z-planes
all suite2p parameters exposed with descriptions
output directory selection
scan-phase correction options for processing
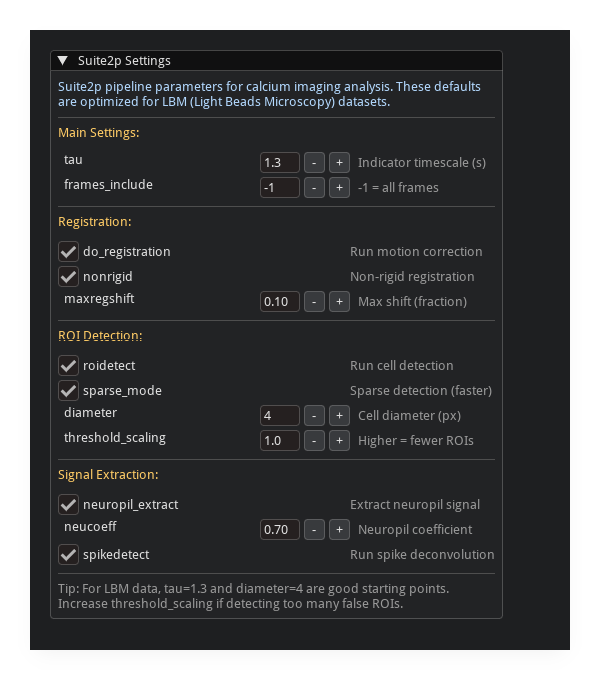
Parameters#
Parameters and settings > Open opens every Suite2p and LBM-Suite2p-Python parameter in one dialog, grouped by Registration, ROI Detection, Signal Extraction, Deconvolution, and Classification.
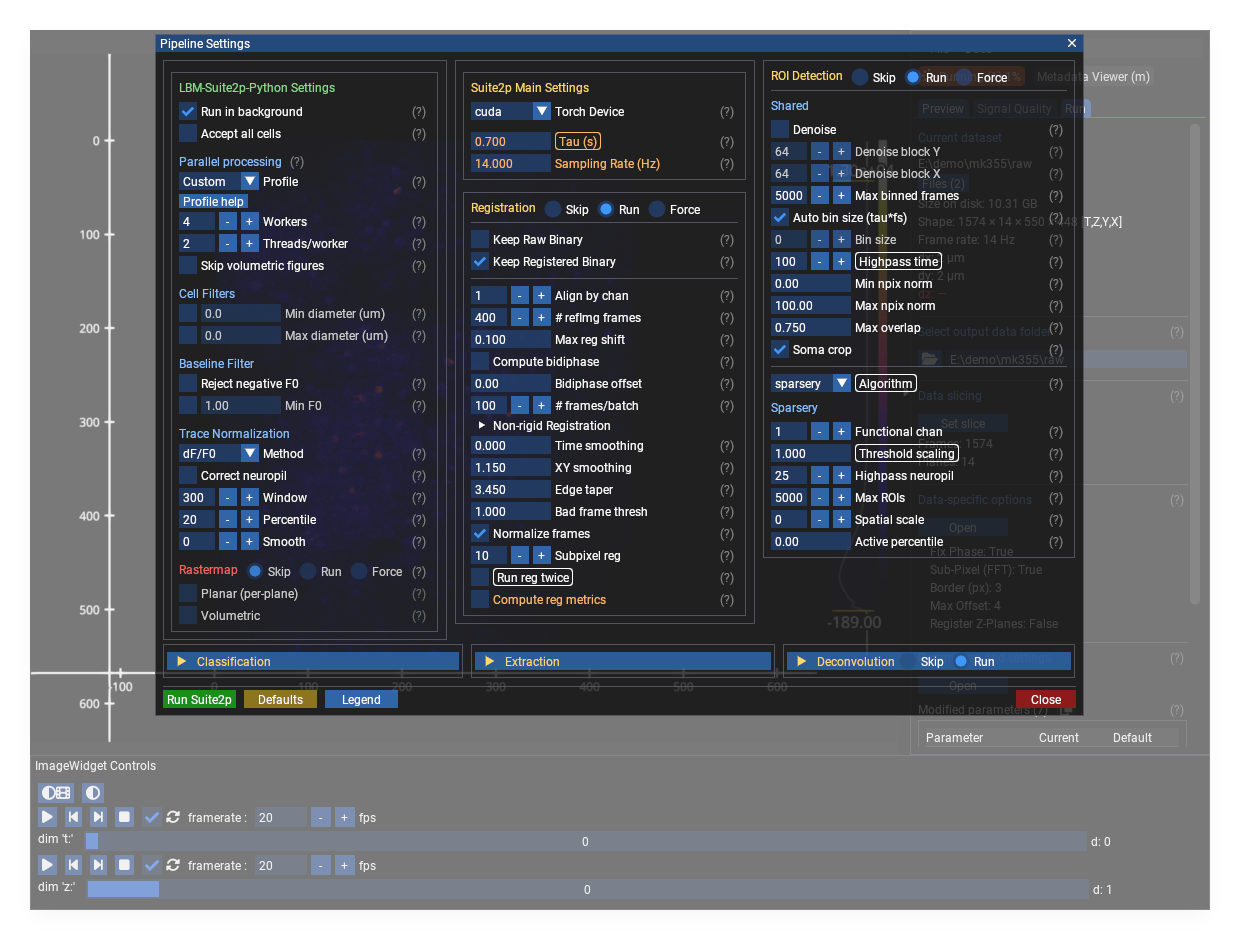
Every Suite2p and LBM-Suite2p-Python parameter in one dialog. Values changed
from the Suite2p default are tinted orange (here tau and the cell diameters),
so non-default settings stand out at a glance.#
The parameter columns are colour-coded. The Legend button (next to Defaults) explains the conventions:
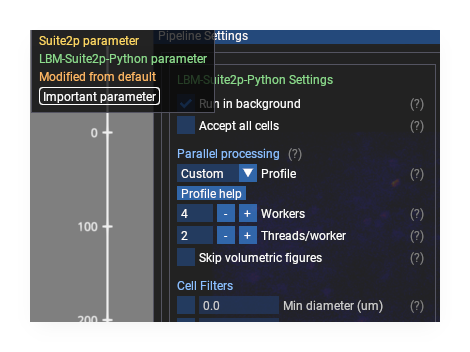
The colour/box legend, opened from the settings dialog.#
Style |
Meaning |
|---|---|
yellow name |
Suite2p parameter |
teal name |
LBM-Suite2p-Python parameter |
orange value |
modified from the Suite2p default |
boxed label |
important parameter (look at these first) |
The Run tab also lists every changed value under Modified parameters, with a copy button that emits a paste-ready Python dict.
Spatial Crop#
click “Add Crop Selector”
drag the yellow rectangle on the image
only the cropped region is processed
External Tools#
The GUI can launch external tools when installed:
suite2p GUI with rastermap integration
cellpose GUI for cell segmentation
window polling detects when external tools close
Results and Diagnostics#
suite2p results viewer with trace quality stats
diagnostics viewer for signal quality analysis
grid search viewer for parameter exploration