1. Preprocessing#
%load_ext autoreload
%autoreload 2

from pathlib import Path
import numpy as np
import tifffile
import fastplotlib as fpl
import matplotlib.pyplot as plt
from sklearn.preprocessing import RobustScaler

from skophys.preprocessing import Vectorizer, UnVectorizer, PercentileFilter

import lbm_caiman_python as lcp
Available devices:
✅ (default) | NVIDIA RTX A4000 | DiscreteGPU | Vulkan | 560.94
✅ | NVIDIA RTX A4000 | DiscreteGPU | D3D12 |
❗ | Microsoft Basic Render Driver | CPU | D3D12 |
✅ | NVIDIA RTX A4000 | DiscreteGPU | D3D12 |
❗ | NVIDIA RTX A4000/PCIe/SSE2 | Unknown | OpenGL |
c:\Users\RBO\miniforge3\envs\lcp\lib\site-packages\numba\core\decorators.py:246: RuntimeWarning: nopython is set for njit and is ignored
  warnings.warn('nopython is set for njit and is ignored', RuntimeWarning)
import matplotlib as mpl
mpl.rcParams.update({
    'axes.spines.left': True,
    'axes.spines.bottom': True,
    'axes.spines.top': False,
    'axes.spines.right': False,
    'legend.frameon': False,
    'figure.subplot.wspace': .01,
    'figure.subplot.hspace': .01,
    'figure.figsize': (12, 8),
    'ytick.major.left': True,
})
jet = mpl.colormaps['jet']
jet.set_bad(color='k')
1.1. scanreader#
raw_data_path = Path().home() / 'lbm_data' / 'behavior'
raw_data_path.is_dir()
True
scan = lcp.read_scan([str(x) for x in raw_data_path.glob('*')], join_contiguous=True)
scan.num_fields
2
save_path = raw_data_path.parent / 'assembled'
1.2. Save as .tiff / .zarr#
lcp.save_as(scan, save_path,overwrite=True, planes=[0, 1, 13, 24, 28], frames=np.arange(0, 1000))
Planes: [0, 1, 13, 24, 28]
movie = tifffile.imread(save_path / 'roi_0_plane_24.tiff')
movie.shape
(1000, 212, 212)
1.3. Threshold your movie#
t = 2000
mask = movie < t
binary_mask = mask > 0

selection = movie.copy()
selection[~binary_mask] = 0
selection.shape
(1000, 212, 212)
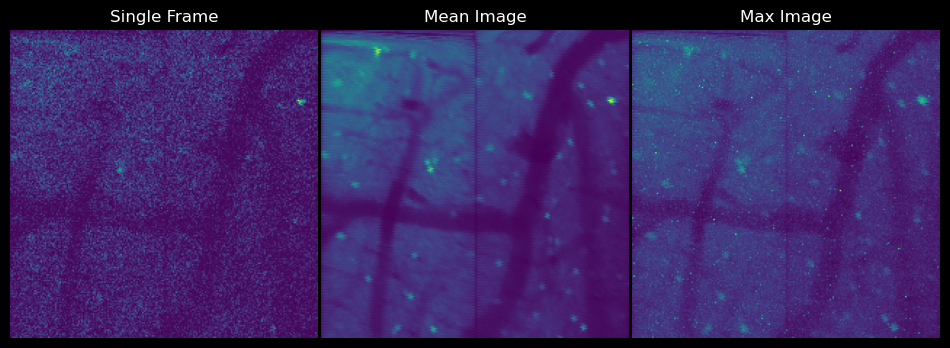
%matplotlib inline

fig, ax = plt.subplots(nrows=1, ncols=3,)

ax[0].imshow(movie[1, ...])
ax[0].title.set_text("Single Frame")
ax[0].axis('off')

ax[1].imshow(np.mean(movie, axis=0))
ax[1].title.set_text("Mean Image")
ax[1].axis('off')

ax[2].imshow(np.max(movie, axis=0))
ax[2].title.set_text("Max Image")
ax[2].axis('off')

plt.show()
unvec = UnVectorizer(movie.shape[1:])
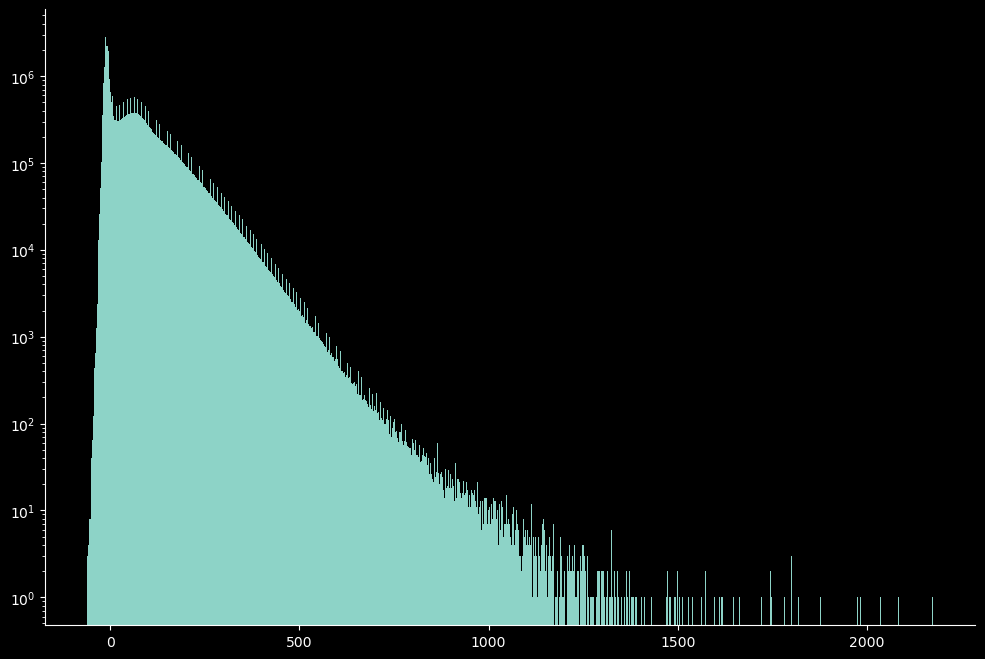
plt.hist(movie.ravel(), bins=1_000)
plt.semilogy()
plt.show()
iw = fpl.ImageWidget(data=movie)
iw.show()
No such comm: 122a8927db5e4e13ba75974e1e7834bf
No such comm: 122a8927db5e4e13ba75974e1e7834bf
iw.close()
1.4. Correlation / Max Images#
from caiman.summary_images import local_correlations, max_correlation_image
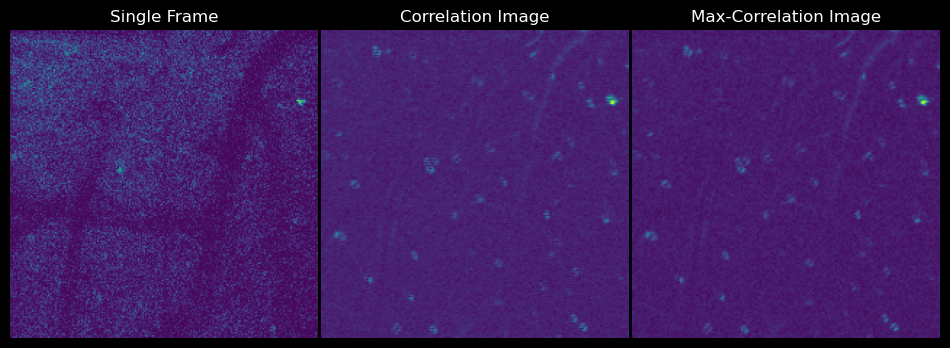
corr_image = local_correlations(movie, swap_dim=False)
max_corr = max_correlation_image(movie, swap_dim=False)
fig, ax = plt.subplots(nrows=1, ncols=3,)

ax[0].imshow(movie[1, ...])
ax[0].title.set_text("Single Frame")
ax[0].axis('off')
ax[1].imshow(corr_image)
ax[1].title.set_text("Correlation Image")
ax[1].axis('off')
ax[2].imshow(max_corr)
ax[2].title.set_text("Max-Correlation Image")
ax[2].axis('off')

plt.show()
corrected = lcp.fix_scan_phase(movie, -1)
2. Scan-phase correction#
corrected.shape
(1000, 212, 212)
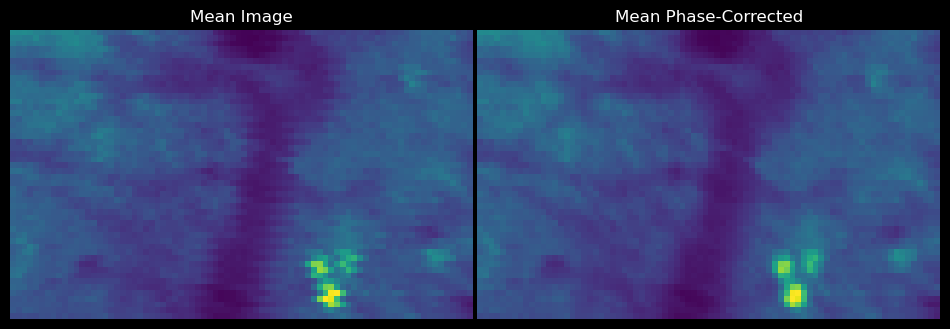
fig, ax = plt.subplots(nrows=1, ncols=2,)

ax[0].imshow(np.mean(movie[:, 50:100, 20:100], axis=0))
ax[0].title.set_text("Mean Image")
ax[0].axis('off')
ax[1].imshow(np.mean(corrected[:, 50:100, 20:100], axis=0))
ax[1].title.set_text("Mean Phase-Corrected")
ax[1].axis('off')

plt.show()
save_path = Path().home() / 'lbm_data' / 'batch' / 'test_roi.tiff'
tifffile.imwrite(save_path, corrected)
f_transform = np.fft.fft2(movie)
f_shift = np.fft.fftshift(f_transform)  # Shift zero frequency to the center

psd = np.abs(f_shift)**2

# Remove 1st/99th percentile
low_percentile = np.percentile(psd, 1)
high_percentile = np.percentile(psd, 99)

filter_mask = (psd > low_percentile) & (psd < high_percentile)
filtered_shift = f_shift * filter_mask

# reconstruct the image
filtered_transform = np.fft.ifftshift(filtered_shift)
filtered_image = np.fft.ifft2(filtered_transform)
filtered_image = np.abs(filtered_image)

fig, axs = plt.subplots(1, 3, figsize=(15, 5))

axs[0].imshow(selection[1, ...], cmap='viridis')
axs[0].set_title("Original Image")
axs[1].imshow(np.log10(psd + 1)[1, ...], cmap='viridis')
axs[1].set_title("Power Spectral Density")
axs[2].imshow(filtered_image[1, ...], cmap='viridis')
axs[2].set_title("Filtered Image")

plt.tight_layout()
plt.show()

2.1. Percentile Filtering#
from ipywidgets import HBox

iw_movie = fpl.ImageWidget(movie, cmap="viridis")
tfig = fpl.Figure()

raw_trace = tfig[0, 0].add_line(np.zeros(movie.shape[0]))

@iw_movie.managed_graphics[0].add_event_handler("click")
def pixel_clicked(ev):
    col, row = ev.pick_info["index"]
    raw_trace.data[:, 1] =  iw_movie.data[0][:, row, col]
    tfig[0, 0].auto_scale(maintain_aspect=False)

HBox([iw_movie.show(), tfig.show()])
iw_movie.window_funcs = {"t": (np.mean, 1)}
filt_movie = PercentileFilter(window_size=5, quantile=5).transform(movie)
iw_movie.set_data(unvec.transform(filt_movie), reset_indices=False)
ss = RobustScaler()
Y = ss.fit_transform(filt_movie.T).T
iw_movie.set_data(unvec.transform(Y), reset_indices=False)
Y = Y[:, :-1]

i1 = 2502
i2 = 2510

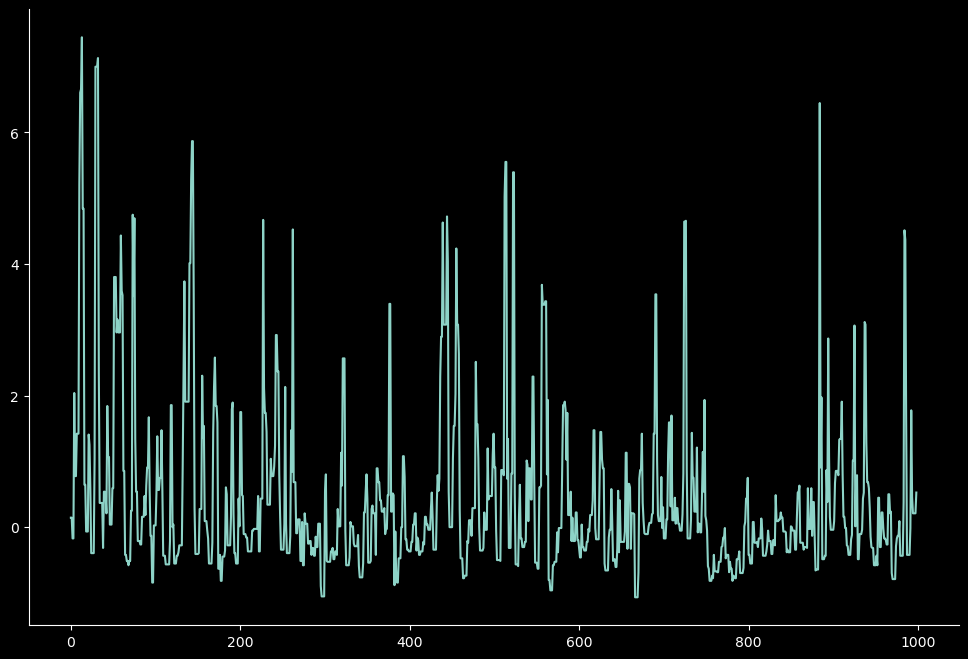
u = Y[i1]
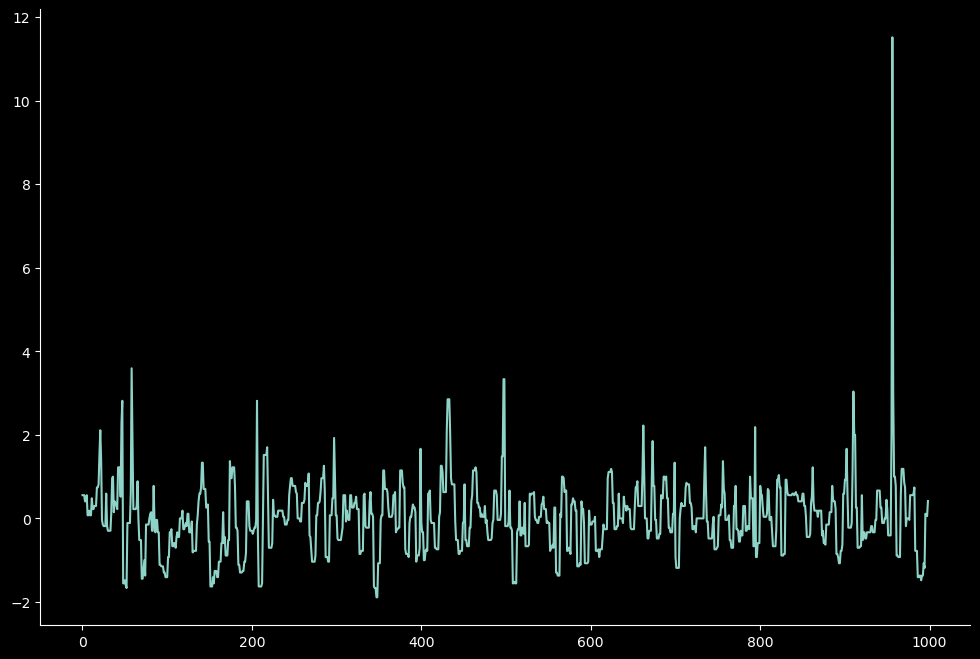
v = Y[i2]

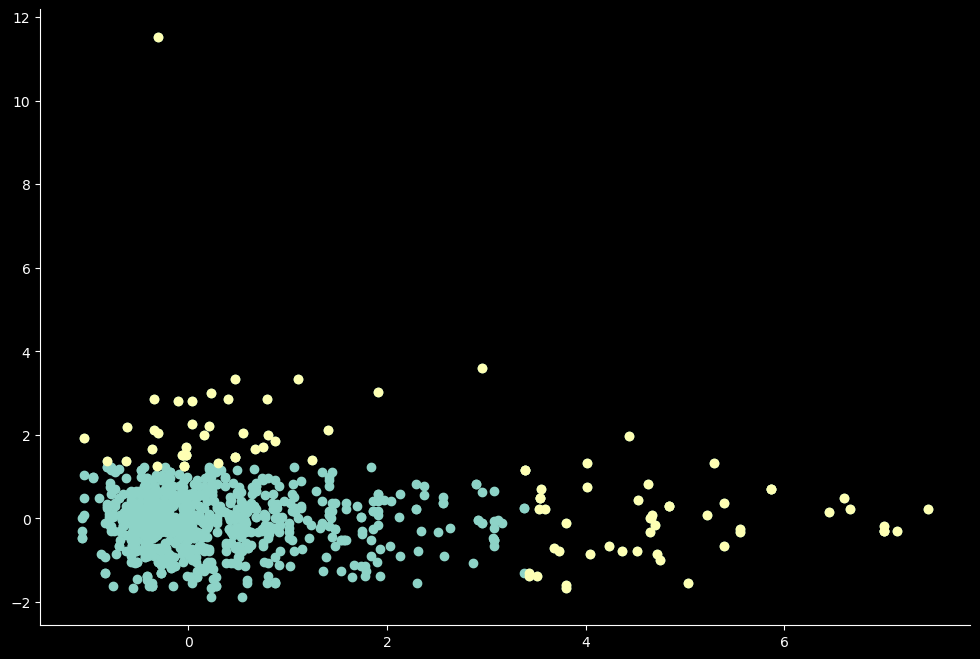
high_vals = (u > np.percentile(u, 95)) | (v > np.percentile(v, 95))

plt.plot(u)
plt.show()
plt.plot(v)
plt.show()

plt.scatter(u, v)
plt.scatter(u[high_vals], v[high_vals])
plt.show()
h = np.array([1, 0])
s = np.column_stack([u, v])
projections = (s @ h)[:, None] * h
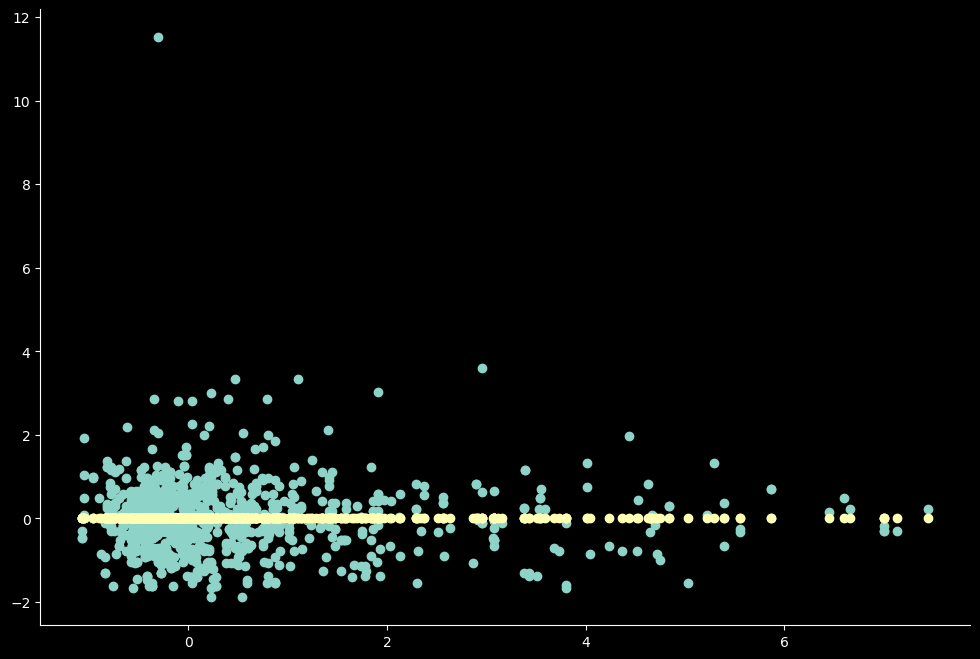
plt.scatter(Y[i1, :], Y[i2, :])
plt.scatter(projections[:, 0], projections[:, 1])
plt.show()
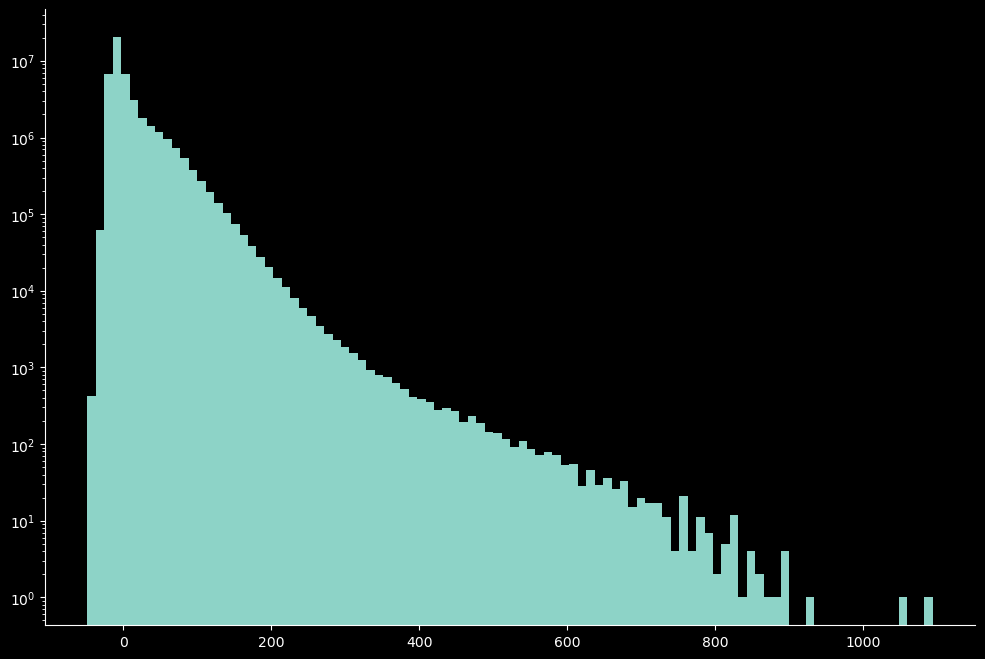
plt.hist(filt_movie.ravel(), bins=100)
plt.semilogy()
plt.show()
